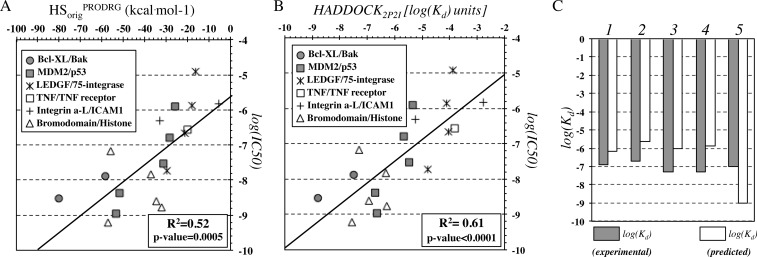
Figure 4.
Correlation plots of experimentally determined binding affinities with (A) the original HADDOCK score (Evdw + 0.2Eelec + Edesol) and (B) the optimized HADDOCK2P2I score. (C) Prediction of affinities for inhibitors of bromodomains that recognize acetylated histone tails for complexes 1–5 corresponding to PDB IDs 3ONI, 4FLP, 3MXF, 3P5O, and 3ZYU, respectively.

