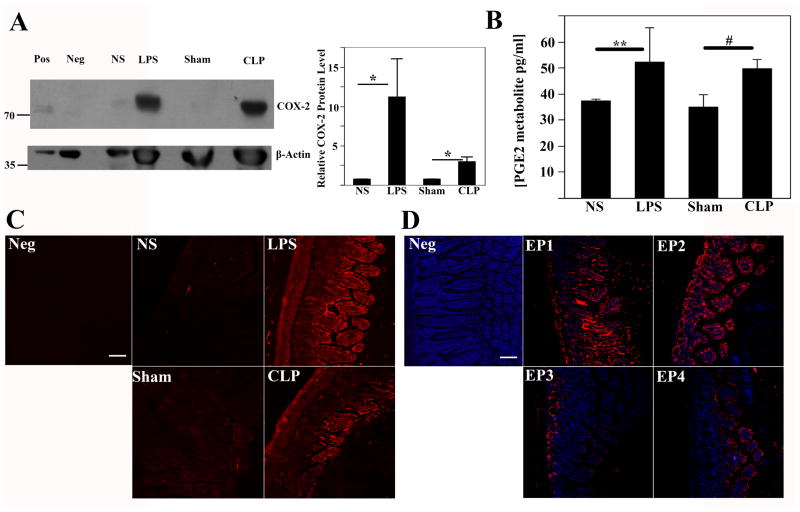
Figure 1. Expression of COX-2, PGE2, and PGE2 receptors during peritonitis. (a) COX-2 protein.
expression in the ileal mucosa 16 h after control treatments (normal saline, NS, and sham), LPS injection, or CLP. Pos and Neg, positive and negative controls, IEC-6 cells treated with and without LPS. β-actin reprobe is shown to demonstrate lane load. Positions of size markers and their molecular weight in kD are on the left. Bar graph shows COX-2 band densities normalized to actin signal. *, significant differences, p<0.01. Data are representative of 3 independent experiments with 1 animal in each group. (b) Levels of stable PGE2 metabolites in ileal mucosa 16 h after indicated treatments. Data are average ±SEM of 3 animals for each data point. Significant differences **(p=0.44), # (p=0.005). (c) Localization of COX-2 (red) in the ileum 16 h after indicated treatments. Neg, negative control, intestinal section from cox-2−/− animal stained for COX-2. (d) Localization of indicated PGE2 receptors (red) in the ileum 16 h after i.p. injection with normal saline. Neg, negative control, a section stained with normal serum substituting primary antibody. DAPI-stained nuclei appear in blue. Bar=100 μm. All immunofluorescence images are representative of at least 3 animals in each group.

