Figure 3. Stable silencing of AP2-μ2 impairs CXCR2-mediated chemotaxis.
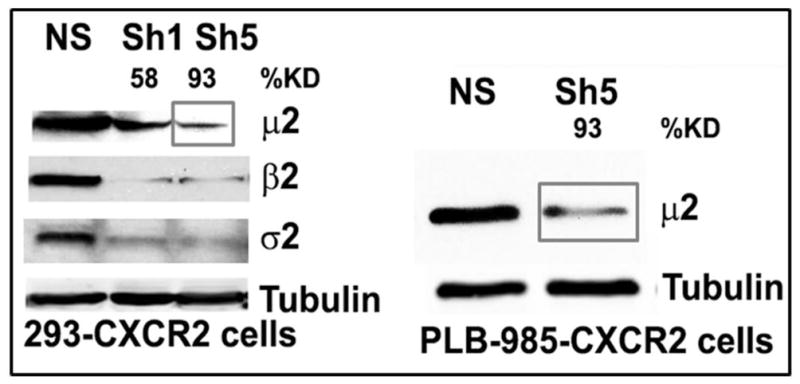
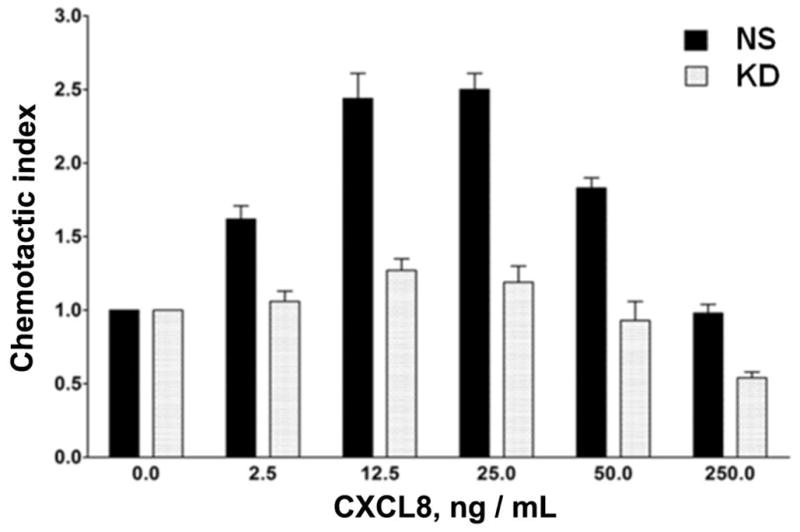
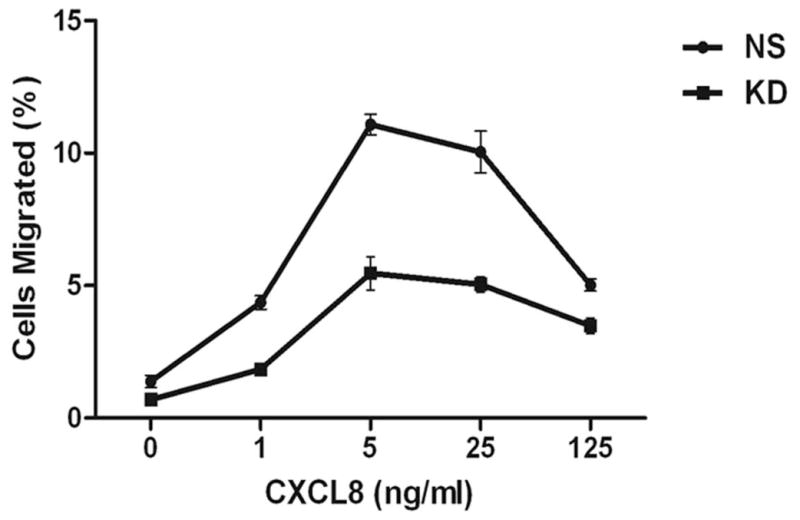
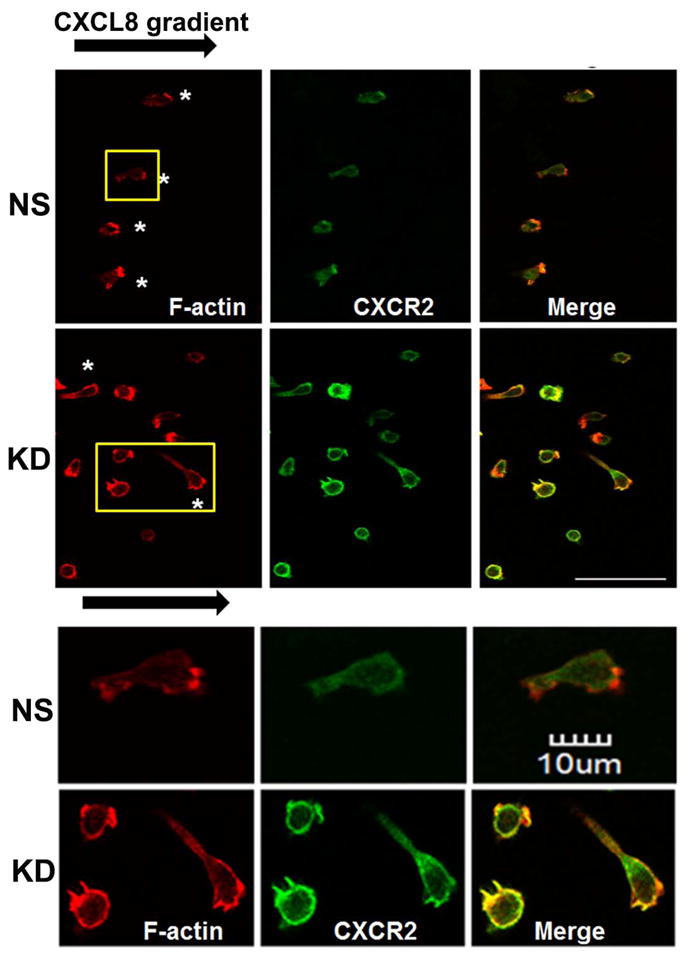
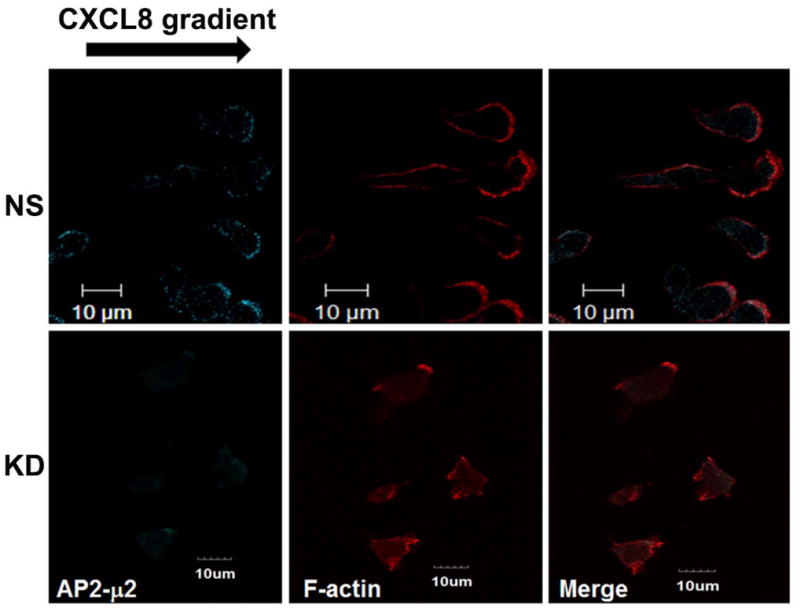
A) Stable knock down of the AP2-μ2 subunit in HEK-293-CXCR2 and PLB-985-CXCR2 cells. Two shRNA constructs sh5 and sh1 were employed to knock down AP2-μ2 in HEK-293-CXCR2 cells and one shRNA construct sh5 was utilized in PLB-985-CXCR2 cells. NS - Non-silencing; % KD – Level of AP2-μ2 knock down. β-tubulin serves as the loading control. B) Stable silencing of the AP2-μ2 subunit impairs CXCR2-mediated chemotaxis in HEK-293-CXCR2 cells. Chemotaxis assays were performed in a modified Boyden chamber. Data were plotted from two independent experiments with 3 replicates in each experiment. NS - Non-silencing; KD-5 - AP2-μ2 knock down; Error bar = S.E.M.; ANOVA: NS vs. KD – for 12.5, 25, and 50 ng / ml CXCL8, p < 0.001; for 2.5 ng / ml CXCL8, p < 0.01; for 250 ng / mL CXCL8, p < 0.05. C) Impairment of CXCR2-mediated chemotaxis of dPLB-985-CXCR2 cells with stable knock down of the AP2-μ2 subunit. Chemotaxis assays were performed in a modified Boyden chamber. Data were plotted from two independent experiments with 4–6 replicates in each experiment. NS - Non-silencing; KD - AP2-μ2 knock down; Error bars - S.E.M. ANOVA: NS vs. KD, p < 0.001 for 1, 5 and 25 ng / mL of CXCL8 and p<0.05 for 125 ng / mL of CXCL8. D) Impairment of polarization of dPLB-985-CXCR2 cells toward the CXCL8 gradient when AP2-μ2 subunit was stably knocked down. Confocal images of dPLB-985-CXCR2 cells were directionally stimulated with 50 ng / ml of CXCL8 in the Zigmond chamber for 10 min. F-actin and CXCR2 were pseudo-colored red and green respectively. Images represent single z-stack sections of 0.5 μm. NS – Non-silenced; KD - AP2-μ2 knock down; Scale bar – 50 μm. An enlarged view of some cells is shown below. E) Comparison of AP-μ2 at the leading edge in polarized dPLB-985-CXCR2 cells with and without AP-μ2 knock down. Confocal images of dPLB-985-CXCR2 cells were directionally stimulated with 50 ng / ml of CXCL8 in the Zigmond chamber for 10 min. F-actin and CXCR2 were pseudo-colored red and green respectively. Images represent single z-stack sections of 0.5 μm. NS – Non-silenced; KD - AP2-μ2 knock down. F) CXCL8-mediated internalization of CXCR2 is attenuated after stable silencing of AP2-μ2 subunit in HEK-293-CXCR2 cells. Non-silencing (NS) and AP2-μ2 knock down (KD) HEK-293-CXCR2 cells (2–5 × 10⁵ cells) were stimulated with 100 ng / ml CXCL8 for different time points, the non-internalized cell surface CXCR2 was quantified by FACS analysis as described in ‘Methods’. The geometric mean of the fluorescence intensity of cell surface CXCR2 was plotted. Error bars - S.E.M. ANOVA: 15 min and 30 min - NS vs. KD – p<0.01.
