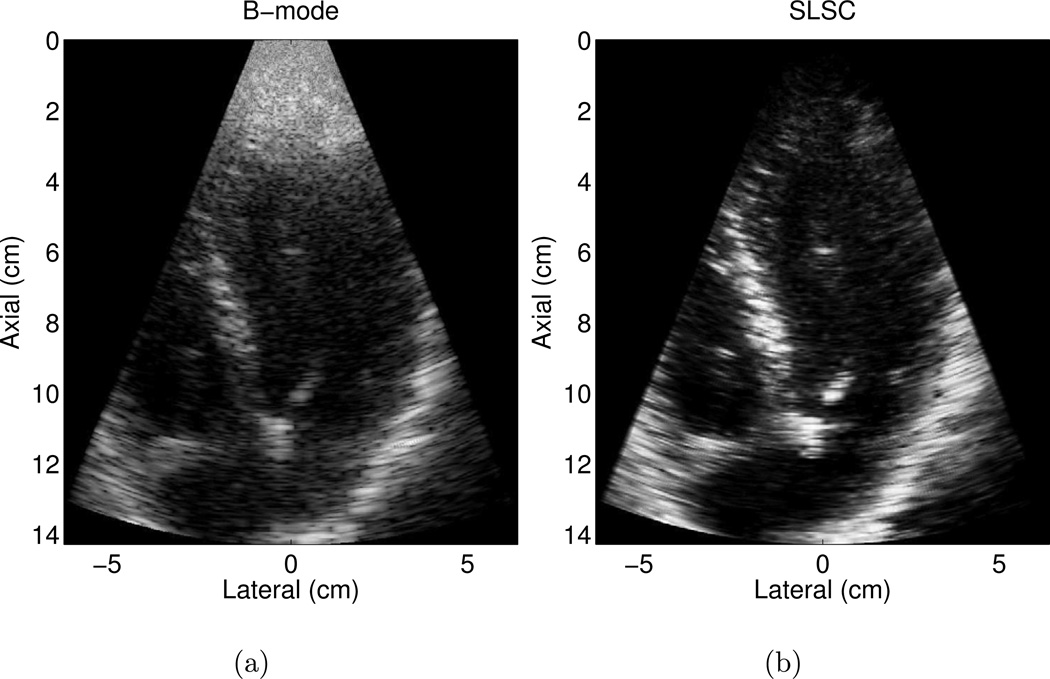
Figure 10.
Apical four chamber view of the left ventricle of volunteer 3 in matched (a) B-mode and (b) SLSC images. The endocardial borders are more clearly defined, particularly in the near field. The transmit focus was 8.3 cm. The B-mode image is shown with 50 dB dynamic range, while the SLSC image is shown on a linear scale ranging from 0 to 95% of the maximum value.

