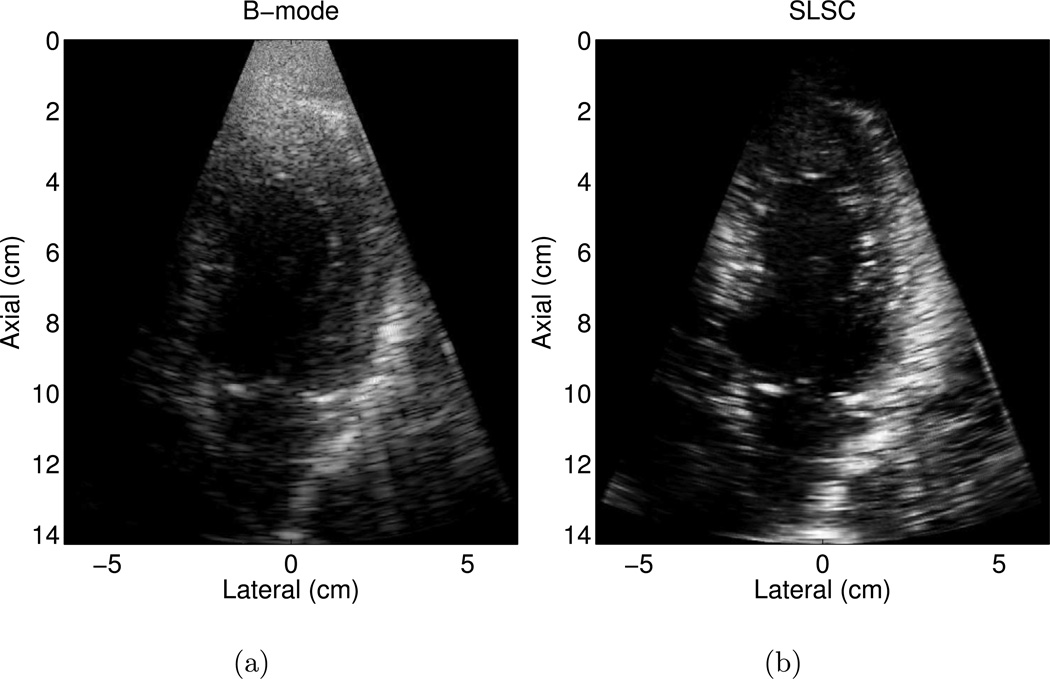
Figure 11.
Apical four chamber view of the left ventricle of volunteer 2 in matched (a) B-mode and (b) SLSC images. There is reduced clutter in the near field of the SLSC image, and the basal lateral segment appears to be missing in the SLSC image compared to the B-mode image (see Supplemental Video #3 for cine loops of these images). The transmit focus was 8.3 cm. The B-mode image is shown with 50 dB dynamic range, while the SLSC image is shown on a linear scale ranging from 0 to 95% of the maximum value.

