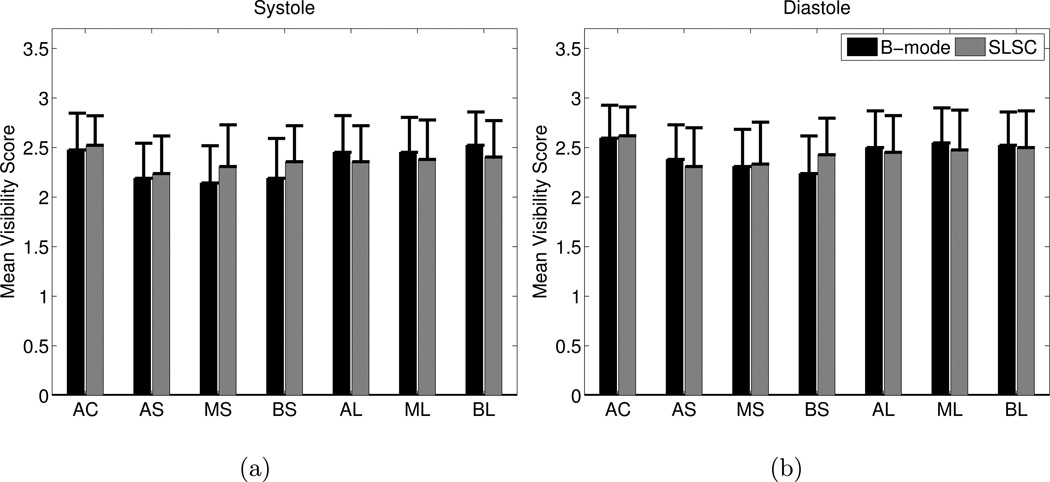
Figure 13.
The mean of the visibility scores (1=clearly seen, 2=poorly seen, 3=not visible) of each segment in B-mode and SLSC images of the apical four chamber view in (a) systole and (b) diastole. AC=apical cap, AS=apical septum, MS=mid inferoseptum, BS=basal inferoseptum, AL=apical lateral, ML=mid anterolateral, and BL=basal anterolateral. The p values exceed 0.05 for all segments in systole and diastole, indicating no statistically significant differences.

