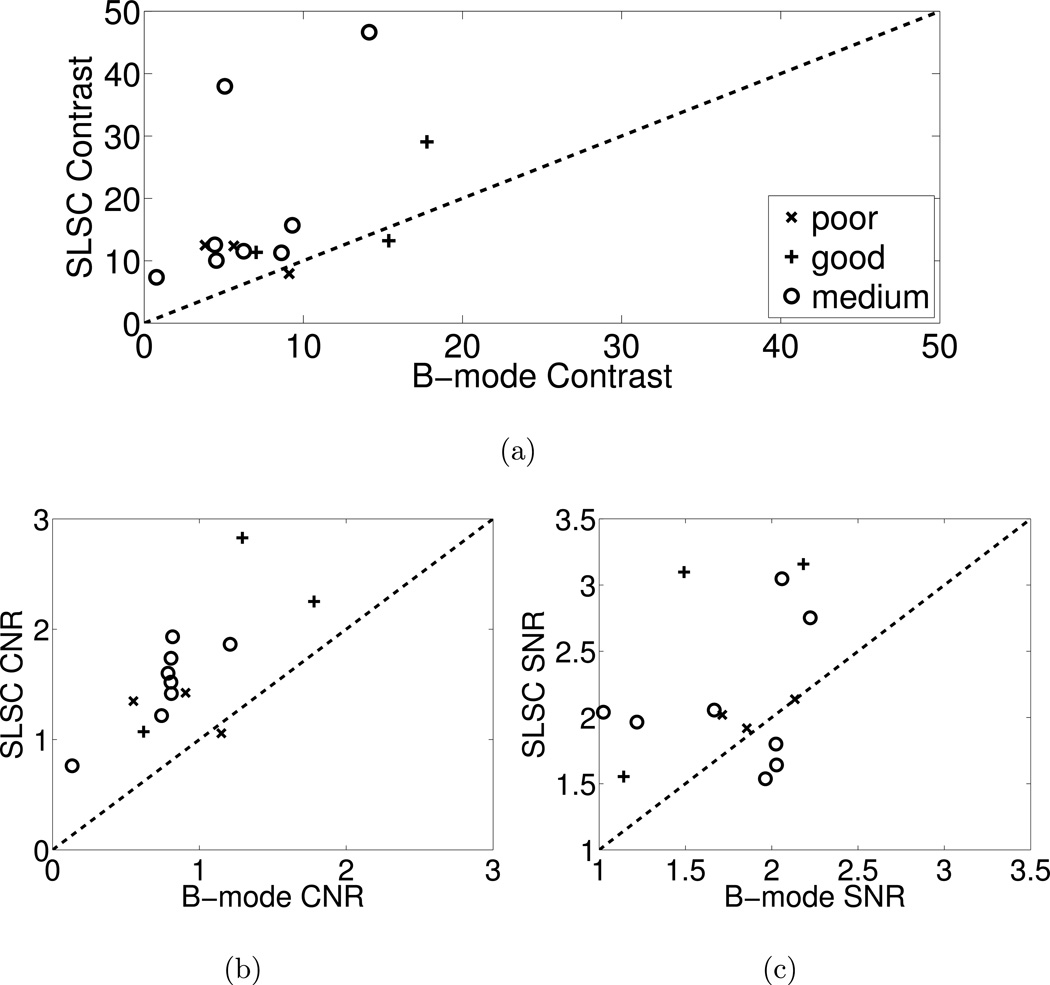
Figure 5.
Scatter plots of (a) contrast, (b) CNR, and (c) SNR measured in B-mode and SLSC images from the 14 volunteers. The data points are categorized by the B-mode image quality determined from the endocardial visibility scores (i.e. good, medium, or poor). Data points above the dashed line indicate better contrast, CNR, or SNR in the SLSC image compared to the matched B-mode image. The SLSC values were calculated with M = 6.

