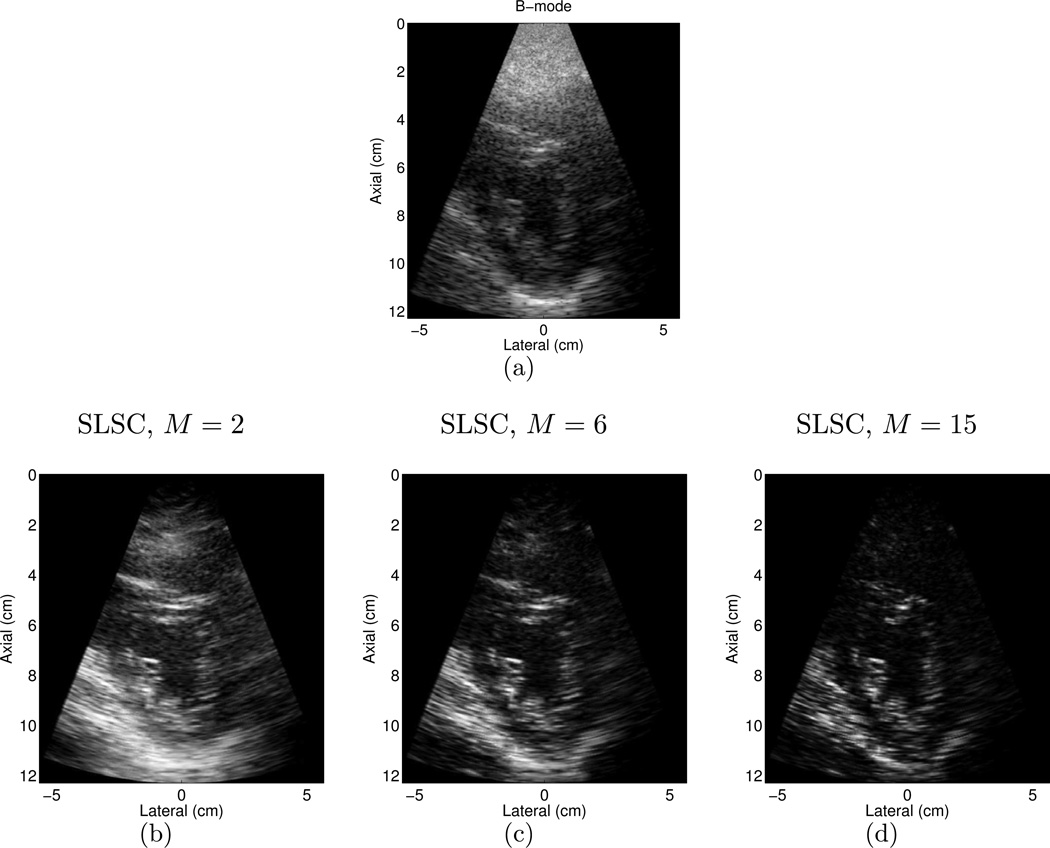
Figure 7.
(a) B-mode image of the LV of volunteer 14, and matched SLSC images created with (a) M = 2, (b) M = 6, and (c) M = 15. Note the changes in contrast, CNR, SNR, and resolution as M is varied. The B-mode image is shown with 50 dB dynamic range, while the SLSC images are shown on a linear scale ranging from 0 to 95% of the maximum value.

