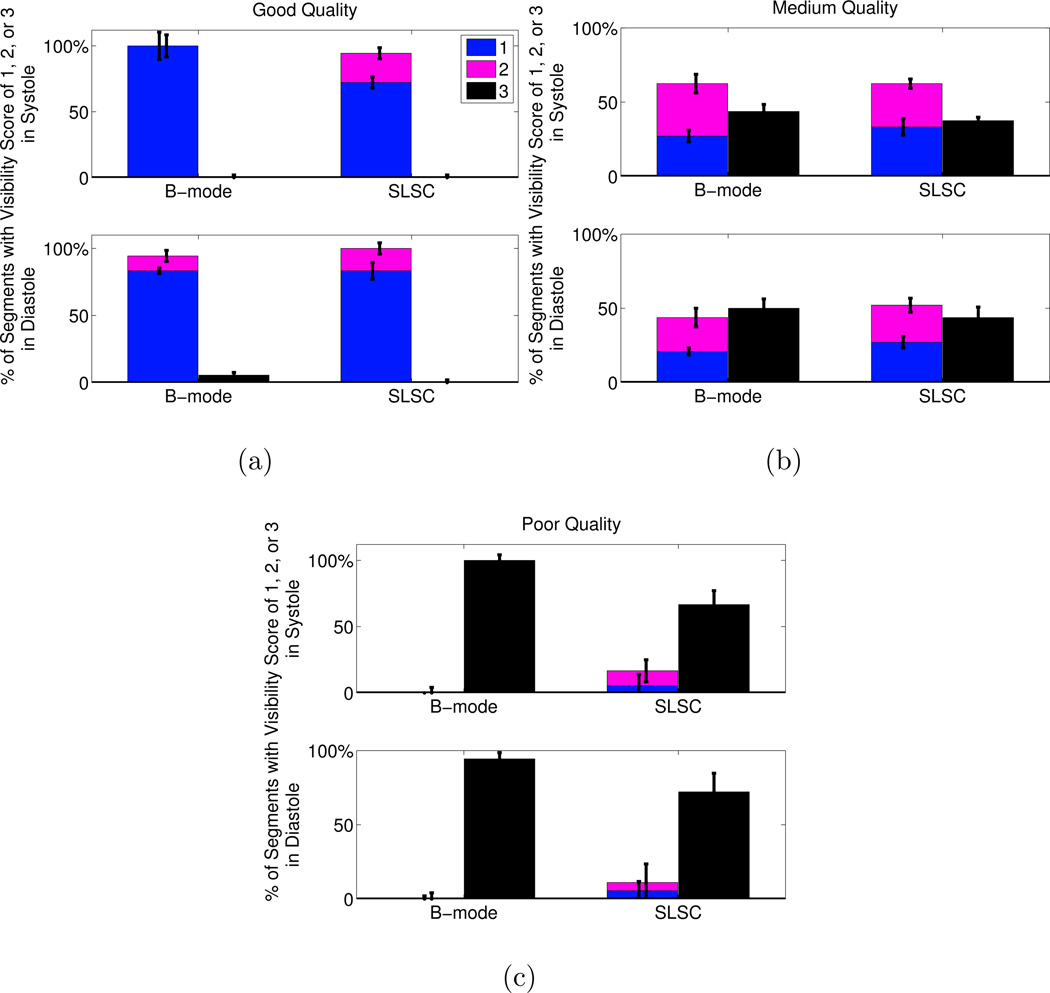
Figure 8.
Visibility of the segments in the short axis view of the LV. The images were separated by B-mode image quality (good, medium, poor). The number of segments with each visibility score (1=clearly seen, 2=poorly seen, 3=not visible) is expressed as a percentage of the total number of segments in each image quality category. The height of the bars represent the median of the three independent observers and the error bars show the interquartile range for each score category in each image quality category in sytole and diastole. The p-values were (a) 1 in systole and diastole in good quality images, (b) 0.45 and 0.64 in systole and diastole, respectively, in medium quality images, and (c) 0.047 and 0.0078 in systole and diastole, respectively, in poor quality images. The kappa statistics indicate fair agreement among the reviewers (κ = 0.30).

