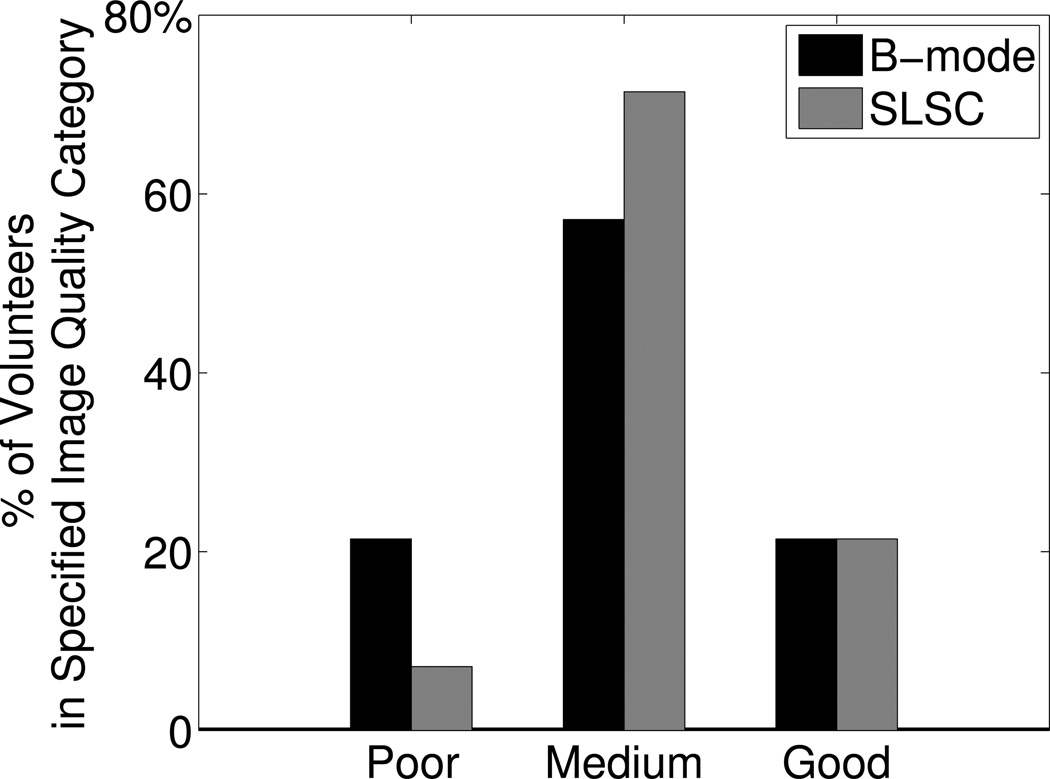
Figure 9.
Percentage of volunteers in each image quality category, as defined by the number of visible segments in B-mode or SLSC images of the LV short axis view. Good quality was defined as 80% or more of the endocardial segments were visualized (score = 1 or 2) by the three reviewers in systole and diastole. Poor quality was defined as 80% or more of the endocardial segments could not be visualized (score = 3) by the three reviewers in systole or diastole. Medium quality was neither poor nor good quality. SLSC imaging decreased the percentage of volunteers with poor quality images.

