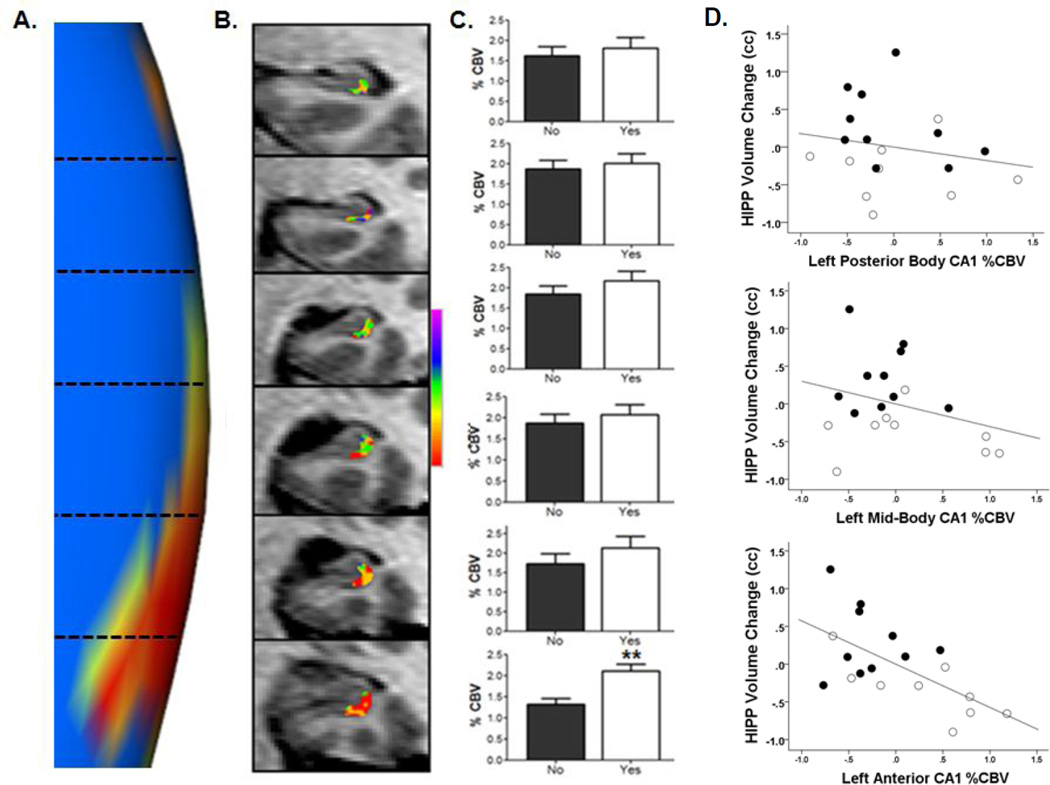
Figure 2. Overlap of anatomical patterns of psychosis-related hypermetabolism and atrophy.
(A) Magnified view of Figure 1C, showing the statistical significance p value map of longitudinal left hippocampal body CA1 subfield morphometric shape change between progressors and non-progressors to psychosis. The orientation from posterior (top) to anterior is divided into representative MRI slices along the long-axis of the hippocampal body as indicated by horizontal dotted lines corresponding with frames in Panel B.
(B) Color map of %CBV shown for a single participant acquired at baseline 24 months prior to onset of psychotic symptoms. Illustrated are 3mm slices in the hippocampus body from posterior to anterior of the left CA1 subfield; each frame corresponding with levels demarcated by dotted lines in Panel A. The map shows a gradient in this individual in left CA1, with %CBV progressively higher (warmer colors) in anterior sectors.
(C) Group-wise data of left anterior CA1 %CBV at baseline, showing differences between patients that subsequently progressed to psychosis (progressors; (“yes”, white bars) versus non-progressors (“no”; black bars). Each bar graph corresponds with the posterior-anterior levels demarcated in Panels A and B. **p< 0.01 peak difference in rCBV in progressors relative to non-progressors. Data are represented as mean ± SEM.
(D) The association between baseline left anterior CA1 %CBV and hippocampal (HIPP) volume change. The scatterplots show data averaged from slices 1–6 shown in Panels A–C into two posterior, middle, and anterior slices. There is a negative association between CA1 %CBV and longitudinal hippocampal volume change that becomes progressively stronger across the posterior-anterior axis reaching significance only in the left anterior CA1 (bottom scatterplot; black=non progressors, white=progressors to psychosis). N=19 of the total n=25 cases are represented in the scatterplot, with n=5 lost to brain imaging follow-up, and one case excluded due to MRI artifact preventing calculation of hippocampal CBV throughout the long axis.
See also Tables S1 and S2.

