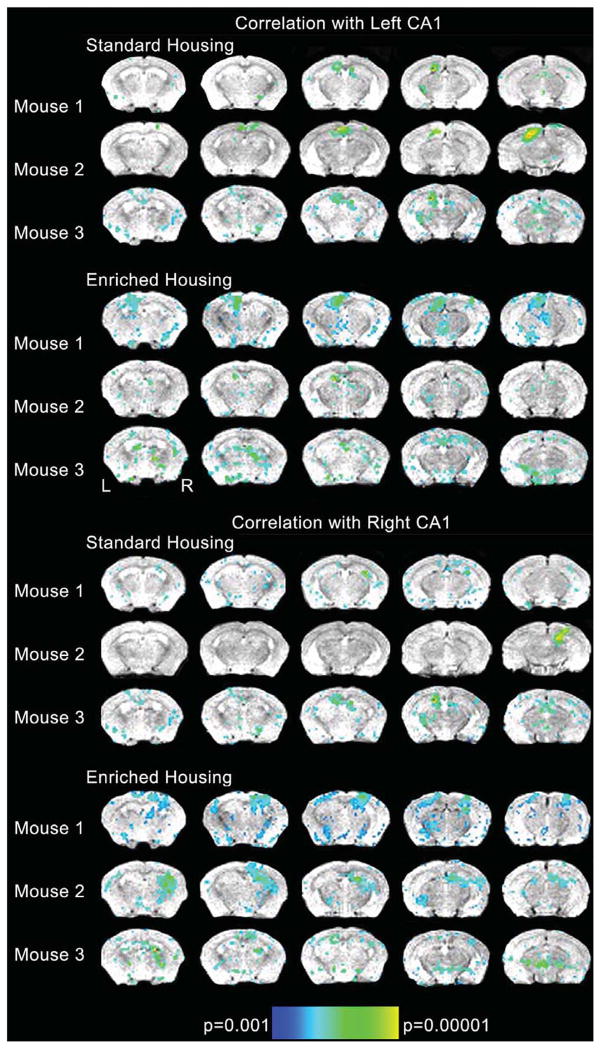
Fig. 1.
Regions that correlated with the extracted time-course from left CA1 and right CA1 for each individual animal. Spin echo anatomical reference T1 weighted images were acquired in the coronal plane with the following parameters: field of view (FOV) = 25.6 × 25.6 mm2, matrix = 128 × 128, slice thickness = 0.5 mm, gap = 0.0 mm, repetition time (TR) = 4000 ms, echo time (TE) = 28.3 ms, number of averages (NEX) = 1, number of slices = 27. Based upon the T1 sequence 5 coronal slices covering the hippocampal formation were placed in reference to the high resolution anatomical images. Blood oxygenation level dependent (BOLD) data were acquired using a gradient echo echo planar imaging (GE-EPI) sequence with the following parameters: FOV = 25.6×25.6 mm2, matrix = 128 × 128, slice thickness = 0.5 mm, gap = 0.0 mm, repetition time (TR) = 1000 ms, echo time (TE) = 10 ms, number of averages (NEX) = 1 for a spatial resolution of 0.2 × 0.2 × 0.5 mm3. Please note that following the EPI sequence, a second high resolution dataset was acquired with the same parameters as above with the exception of slice prescription and number of slices which matched the EPI prescription. This was collected to allow better co-registration with the high resolution dataset given the limited spatial coverage of the EPI. Data was first converted from Paravision format to Analyze using the Bruker2Analyze Toolkit associated with MRIcro (http://www.pvconv.sourceforge.net). Data were preprocessed using the SPMMouse toolbox within SPM5 [18] with corrections for high frequency oscillations expected with cardiac output and respiration, and co-registration with the high resolution anatomical images. The EPI data were first realigned to the first volume acquired using a least squares method and rigid body transformation. The data were also smoothed with a Gaussian kernel of 0.2 mm3. Three seed voxels were placed in both the left and right CA1 region identified on the high resolution images. The timecourse from seed voxel each region of interest was extracted and averaged with the other two seed voxel timecourses from that cerebral hemisphere resulting in one average timecourse for left and one average timecourse for right CA1 for each of the six mice. This averaged time-course was then correlated with all other voxels in the brain. We applied a threshold of p < 0.001 and a cluster threshold of 6 voxels without additional correction for multiple comparisons to each individual dataset. Correlation analyses were carried out between the seed reference and the whole brain for each animal in a voxel-wise manner. To improve normality, a Fisher’s z-transform was applied. From these, the individual z value was submitted to a random effects one-sample t test for each animal. A false discovery rate was applied to reduce errors associated with multiple comparisons. Significance for each animal was set at p(FDR) < 0.05.

