Figure 13.
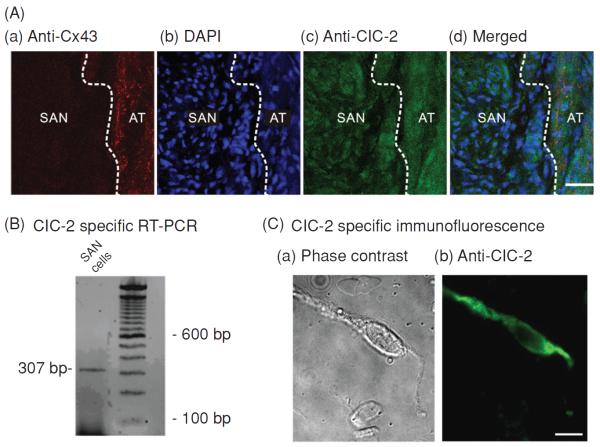
Molecular expression of ClC-2 in SAN cells. (A) Localization of ClC-2 chloride channels in guinea-pig SAN tissue. (a) Section labeled with anti-Connexin 43 (red) to illustrate the adjacent atrial (AT) septum was positively labeled while the SAN was negative (dark region), which clearly delineates the SAN region from the AT septum (dashed white line). (b) Section stained with 4′,6-diamidino-2-phenylindole (DAPI) (blue) to compare nuclei density in the SAN region and in AT. The SAN region had a higher DAPI staining density (higher nuclei density) than the adjacent AT. (c) Section stained with anti-ClC-2 (green). ClC-2 immunoreactivity is evident in both SAN and AT regions. (d) Merged images of a, b, and c illustrate that ClC-2 is expressed in the densely nucleated and Cx43 negative SAN region. (B) Agarose gel depicting real time polymerase chain reaction product of ClC-2 amplified from mRNA prepared from enzymatically dispersed guinea-pig SA nodal cells. (C) Images of ClC-2-like immunofluorescence in a representative SAN cell visualized using fluorescent microscopy. Phase contrast (a) and fluorescent micrographs (b) of a single SAN cell.

