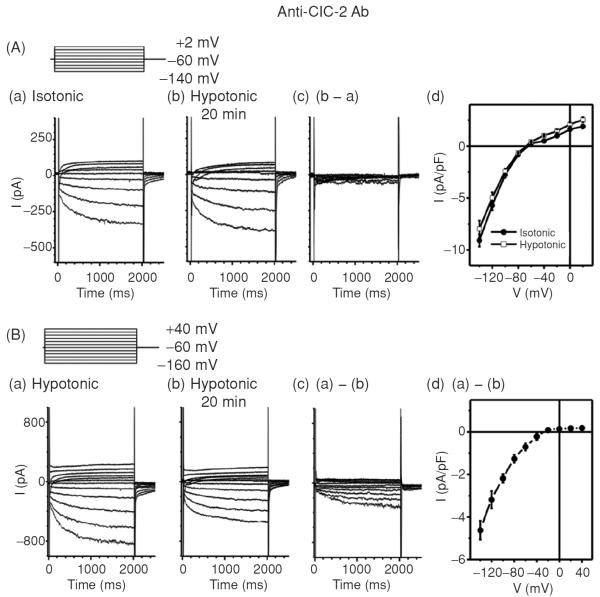
Figure 14.
Effects of Anti-ClC-2 Ab on ICl,ir in SAN cells. (A) Representative whole-cell currents recorded from SAN cells under isotonic (panel a) and hypotonic (panel b) conditions in the presence of anti-ClC-2 Ab in the pipette solutions. SAN cells were exposed to isotonic solution for at least 10 min before whole-cell recordings. Currents shown in panel a were recorded right after successful whole-cell configuration under isotonic conditions. Currents shown in panel b were recorded after exposure to hypotonic solution for 20 min. Pipette and bath solutions were identical to those described in Figure 1B except the pipette solution contained 3 μg/mL anti-ClC-2 Ab. (d) Mean I–V from 5 SAN cells under the same conditions. (B) SAN cells were exposed to hypotonic solution for 20 min to fully activate ICl,ir before whole-cell recordings. Bath and pipette solutions were the same as in panel A. Representative current traces recorded by voltage-clamp (protocol is shown in inset) from the SAN cell immediately after membrane rupture (a) and after 20 min of anti-ClC-2 Ab dialysis (b). The anti-ClC-2 Ab-sensitive current (a)–(b) is shown in (c) (current traces) and (d) (mean I–V, n = 5). Notice the anti-ClC-2 Ab-sensitive current (c) was similar to ICl,ir shown in Figure 1 and the typical ICa and If (b) were not affected by anti-ClC-2 Ab.

