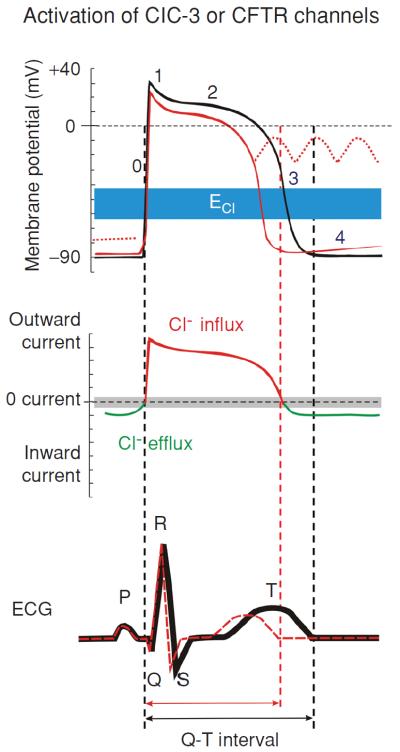
Figure 2.

Modulation of cardiac electrical activity by activation of Cl− channels in heart. Changes in action potentials (top), membrane currents (middle), and ECG (bottom) due to activation of CFTR or volume-regulated ClC-3 Cl− channels are depicted. Top panel: numbers illustrate conventional phases of a prototype ventricular action potential under control conditions (black) and after activation of ICl (red). Range of estimates for normal physiological values for Cl− equilibrium potential (ECl) is indicated in blue. Middle panel: range of zero-current values corresponding to ECl is shown in grey. Activation of CFTR or ClC-3 channels generates both inward (indicated by green) and outward (indicated by red) currents and cause both depolarization as well as repolarization during the action potential. Activation of ICl, therefore, induces larger membrane depolarization and induction of early afterdepolarizations under conditions where resting K+ conductance is reduced (dotted red lines in top panel). Bottom panel: the letters (P, Q, R, S, and T) indicate the conventional waves of electrocardiograph (ECG) complex under control conditions (black) and after activation of ICl (red). Corresponding to the shortening of action potential in ventricular myocytes activation of ICl causes a shortening of Q–T interval. See text for details (48). (Copyright Request: Duan D. J Physiol 587: 2163–2177, 2009.)
