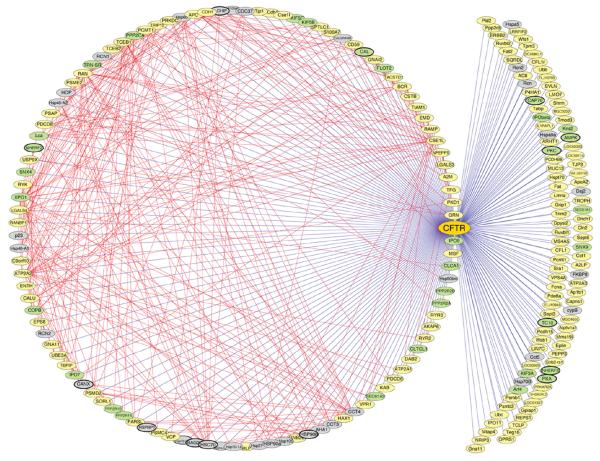
Figure 4.
The cystic fibrosis transmembrane conductance regulator (CFTR) interactome. All components comprising the CFTR interactome are depicted as nodes (ovals) in the network. Components identified in previous studies as CFTR interactors are highlighted with bold lines surrounding the ovals. Straight blue lines are edges in the network that show direct or indirect protein interactions between CFTR and the indicated component identified by MudPIT. Straight red lines illustrate edges that define interactions based on the BIND (http://www.bind.ca/Action) and DIP (http://dip.doe-mbi.ucla.edu/) protein interaction databases and the Tmm coexpression database (http://microarray.cpmc.columbia.edu/tmm/), which were accessed using the Cytoscape platform (http://www.cytoscape.org/). Proteins involved in folding and export from the ER are illustrated as gray nodes; green nodes highlight protein interactions involved in postendoplasmic reticulum trafficking and activity. Yellow nodes indicate interactors with unknown function. See the Supplementary Discussion for a more complete description of proteins defined by green and yellow nodes. The network includes proteins involved in the modulation of CFTR folding and function (162). (Copyright request: Wang et al. Cell 127: 803–815, 2006.)

