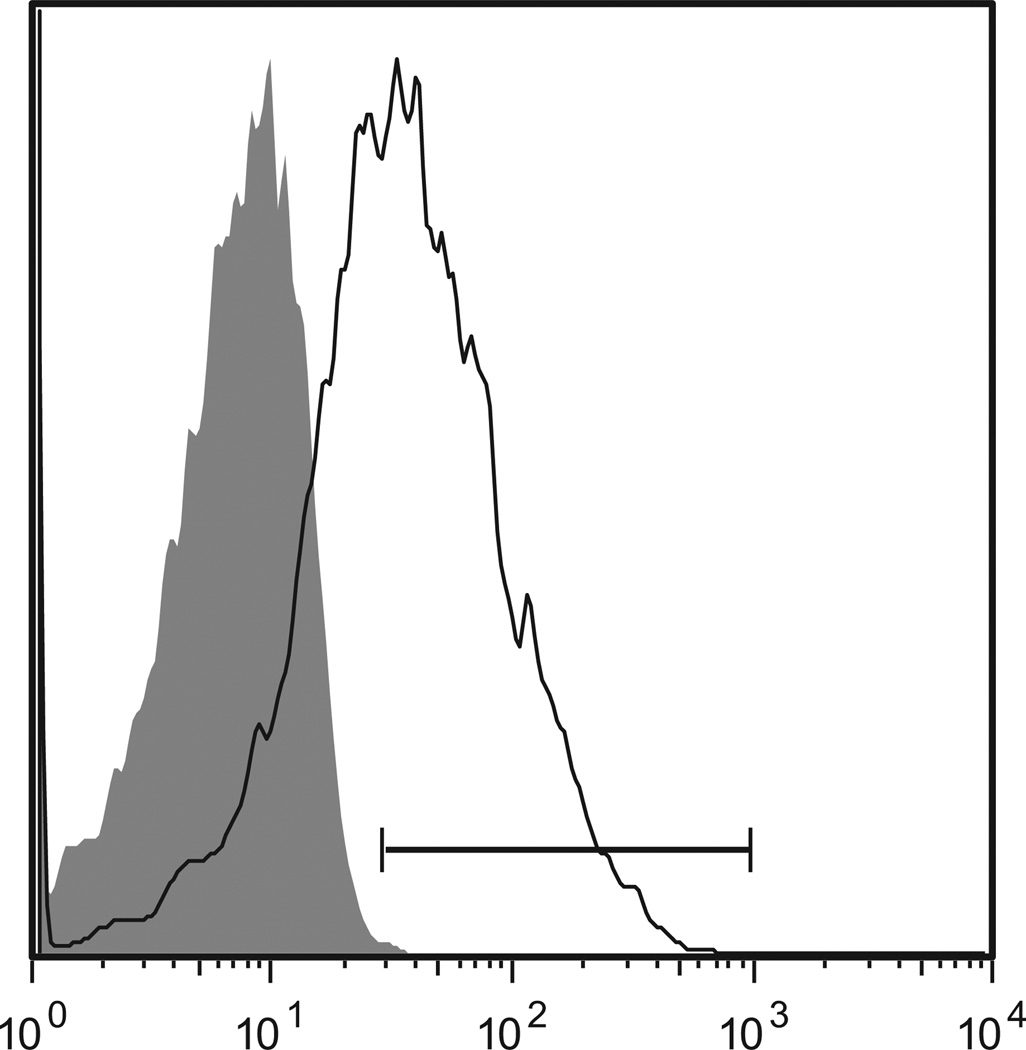
Figure 2.
FACS histogram for expression of Tim-3 on gated CD8+ T cells from a patient with clinically significant acute GVHD (PT no. 0728). The shaded area represents the staining profile for an isotype-negative control antibody, and the horizontal line represents the gating used to define positive expression of Tim-3 (57.5%). The x-axis represents fluorescent intensity and the y-axis represent number of events.

