Fig. 6.
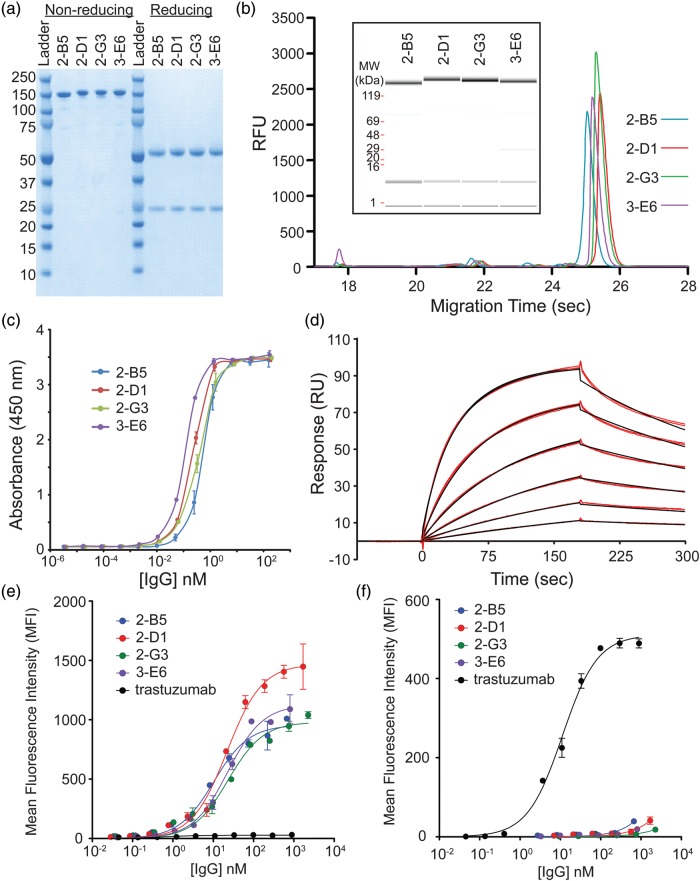
Characterization of purified IgGs. (a) The final purified anti-CEA IgGs run predominantly as a single band on a non-reducing SDS–PAGE gel consistent with the full-length IgG. Under reducing conditions, bands consistent with the HC and LC fragments are observed. (b) Caliper analysis reveals the high purity of the final IgGs. The inset shows the same sample traces where the amount of protein is indicated by the band intensity. (c) An ELISA of the purified anti-CEA IgGs have sub-nanomolar EC50 values for CEA. (d) A sample Biacore trace (red lines) for the 2-G3 anti-CEA IgG and global fit to a bivalent binding model (black lines). Binding was measured in duplicate at 1.3, 2.5, 5.1, 10.1, 20.3 and 40.5 nM over three separate channels. A bivalent model fit the data better than simple 1 : 1 binding as expected for a bivalent IgG. (e) The reformatted IgGs show apparent high affinities on MKN45 cells which express high levels of CEA, while the wt trastuzumab (expressed in CHO) IgG does not. (f) The wt trastuzumab IgG (expressed in CHO) binds to the ErbB2/HER2 expressing SKBR3 cells, but the selected CEA-specific IgGs do not.

