Fig. 3.
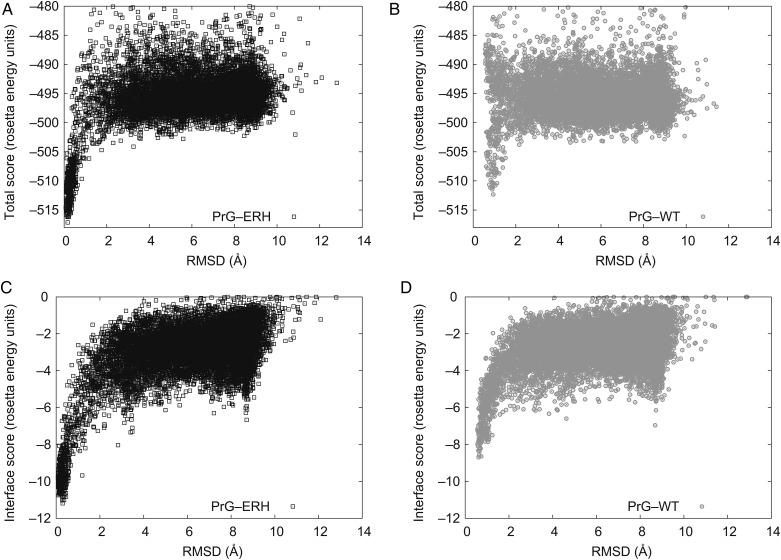
Scatter plot of predicted model energy versus deviation from the designed structure for a series of docking perturbations. Each point on the plot is a Rosetta model perturbed from the selected minimum energy conformation for mutant complex or relaxed native complex and their backbone deviation referenced to the selected mutant complex with lowest binding energy. Both the triple mutant ERH PrG (black/left) and the relaxed native (gray/right) show the onset of a strong correlation between model's energy and its atomic deviation from the structure of our designed model. This ‘funnel’ is deeper, sustained over a wider range, and more populated for the mutant than the native. For expository convenience, the native models are shown referenced to the designed structure not their relaxed native structure: none of the low energy native models are within ∼1 Å of the designed mutant model (RMS C-alpha superposition) so their funnel minimum is displaced. (A and B): The total energy indicates the relative stability of the complex. (C and D): The interface score is the bound minus unbound total energy.

