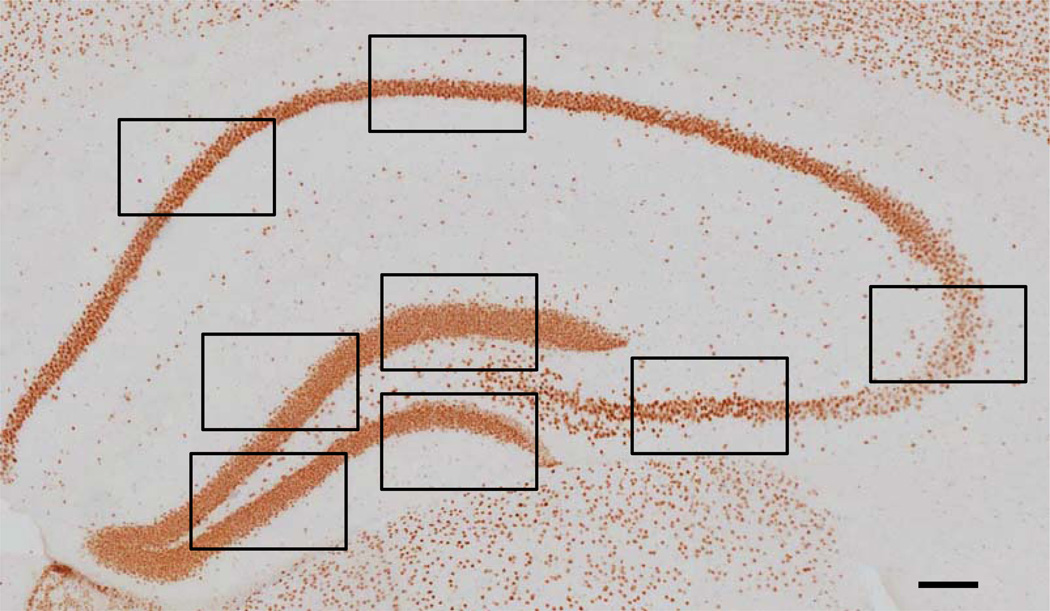
Fig. (1).
Hippocampal HDAC2 IR. Representative image of a hippocampal section stained for HDAC2 (bregma level −1.58). The black boxes indicate where the high-magnification images were taken for the analysis. A total of 32 images per animal (i.e. four images in the dentate gyrus, two in the CA3 and two in the CA1-2 regions, at four different bregma levels) were taken for the analysis (see text for more details). Scale bar = 100 µm.

