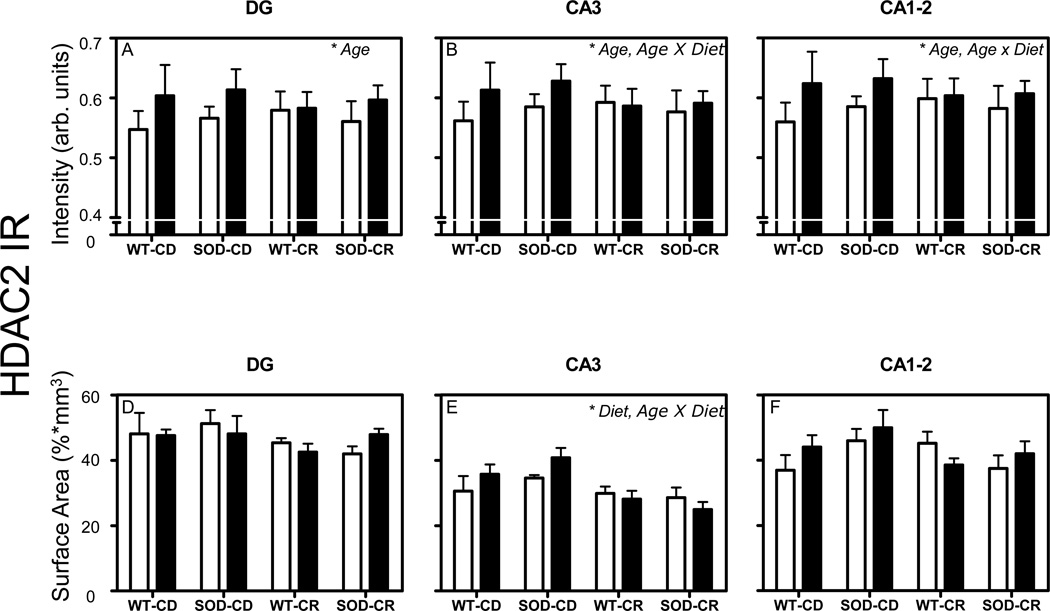
Fig. (4).
HDAC2 intensity and surface area. Mean and standard error of means of mean intensity value measurements of HDAC2 IR (A–F). Pooled data from the 4 groups of 12-month-old (white bars) and 24-month-old mice (black bars) are represented separately for DG (A, D), CA3 (B, E), and CA1-2 (C, F). Volume corrections were applied for the surface area occupied by HDAC2 IR measurements. Significant effects (p < 0.05 in all cases) in each analysis are indicated with an asterisk in the top right corner of each graph. AU= arbitrary units.

