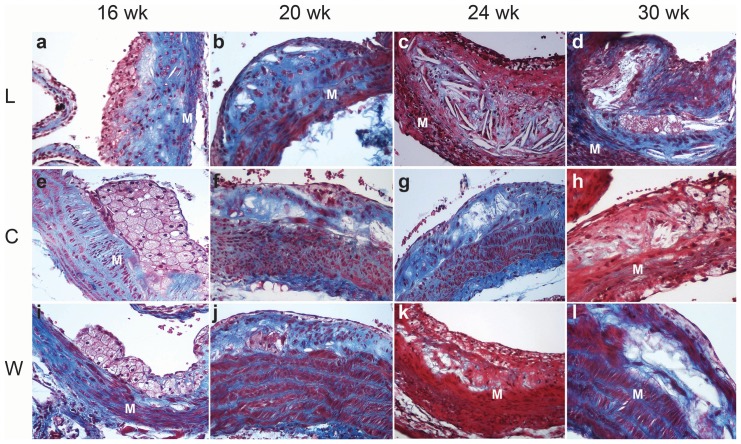
Figure 1. Representative microphotographs of atherosclerotic plaque evolution in L, C and W groups over the study time.
Rows (treatment): L, C, W. Columns (age): 16 wk, 20 wk, 24 wk, 30 wk. At the end of treatment: collagen deposits (blue) and cholesterol crystals were observed between clustered foamy macrophages; the thinned subendothelial muscle layer was partially replaced by collagen (M) in the aortic wall in L group (a). Differently C group (e) showed large clusters of subendothelial foamy macrophages over a hypertrophic muscular layer which was partially replaced by collagen (blue). A striking increase in atherosclerotic plaque size relative to muscle layer thickness (M) was observed in L (a–d) compared with C (e–h). Characteristic changes of the natural history of atherosclerotic plaque previously reported in this murine model were found in W group as expected (i, l). Masson's trichrome, original magnification 200×.

