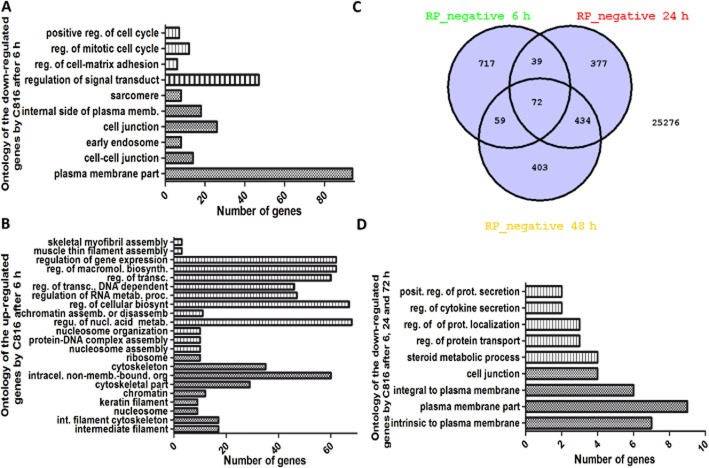
Figure 2.
Gene ontology of the down-regulated (A) and up-regulated (B) biological processes and cell components in HepG2 cells after 6 h of C816 treatment. Hatched bars: biological processes level 5. Stippled bars: cell components level 5. (C) Venn diagram for the down-regulated mRNAs in HepG2 cells after C816 treatment. (D) Gene ontology of the down-regulated genes shared by the three time points analysed. Hatched bars: biological processes level 5. Stippled bars: cell components level 5.

