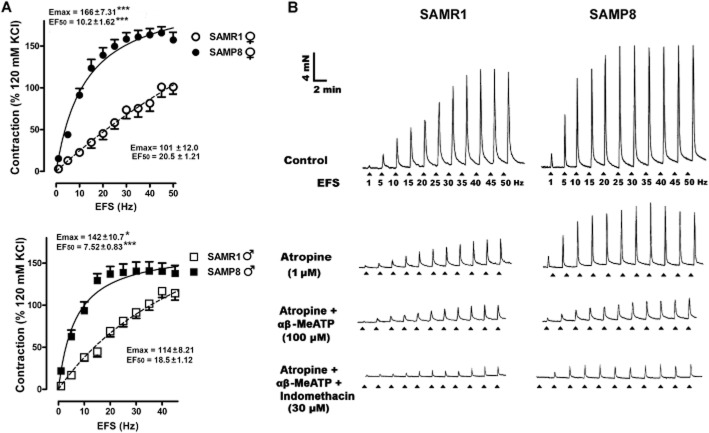
Figure 2.
Frequency-dependent contractile response in the detrusor muscle of SAMP8 and SAMR1 mice. (A) Frequency–response curves in female (top) and male (bottom) SAMR1 or SAMP8 detrusor muscles. The data represent the contraction relative to that induced by 120 mM KCl (mean ± SE, n = 10–14). The Emax and EF50 values obtained from the respective curves are included in the figure: *P < 0.05; ***P < 0.001 versus SAMR1. (B) Representative traces for male SAMR1 (left) and SAMP8 (right) mice in which detrusor contractions were elicited by EFS (5 s, 1–50 Hz) under control conditions (top) and after 30 min of cumulative incubations with atropine (1 μM), αβ-MeATP (100 μM) and indomethacin (30 μM, bottom).

