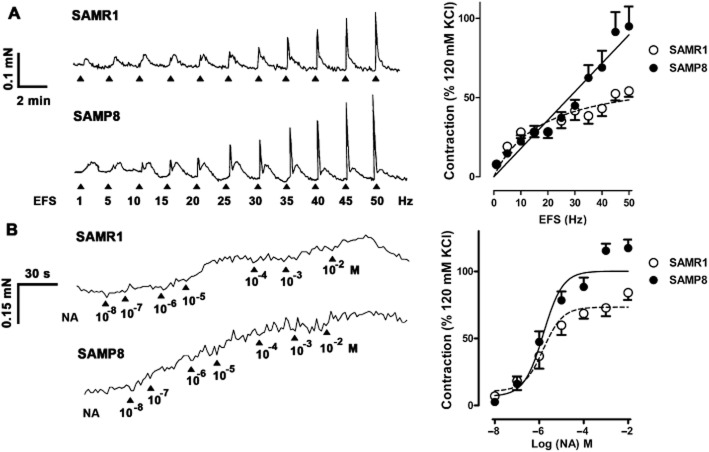
Figure 5.
Contractile responses in SAMP8 and SAMR1 urethras. (Left) Representative traces showing SAMR1 (top) and SAMP8 (bottom) urethral contractions elicited by EFS (5 s, 1–50 Hz; A) and by cumulative addition of noradrenaline (10−8 to 10−2 M; B) in the presence of L-NOARG (0.1 mM) and D-tubocurarine (0.1 μM). (Right) Frequency–response curve (A) and concentration–response curve (B) for SAMR1 and SAMP8 urethras. The data are represented relative to the contraction induced by 120 mM KCl (mean ± SE; n = 10–13).

