Figure 7.

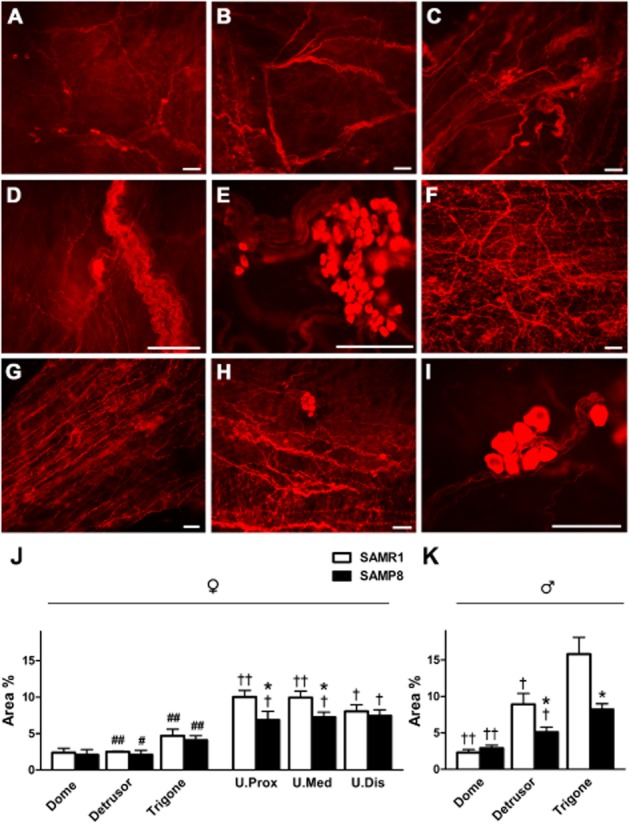
nNOS-ir in SAMR1 and SAMP8 bladders and urethras. (A) nNOS-ir in the bladder dome from a female SAMR1 mouse showing the dispersion of the nitrergic nerves. Note the scattered presence of small nNOS-ir ganglion cells. nNOS-ir in the detrusor (B) and trigone (C) from a male SAMP8 mouse. An increased density of nitrergic nerves, ganglia and nerve trunks is apparent in the trigone. Higher magnification image showing nNOS-positive nerve trunks and intramural ganglion cells positive for nNOS in the trigone of a female (D) and a male (E) SAMR1 mouse. (F) nNOS-ir in the medial urethra of a SAMR1 mouse showing abundant nitrergic innervation. nNOS-ir in the proximal (G) and distal (H) SAMP8 urethra: note the slight reduction in nitrergic nerve density compared with the SAMR1 urethra (F). (I) High magnification image showing nNOS-positive intramural ganglion cells in the medial urethra of a SAMP8 mouse. Scale bar = 50 μm. Quantification of nNOS-ir in the muscle layer of SAMR1 and SAMP8 female bladders and urethras (J), and in male bladders (K). Measurements were taken independently in different regions of the bladder (dome, detrusor and trigone) and urethral muscle layers (proximal, medial and distal). Hand-drawn fields of whole-mount preparations were selected and the relative area above the intensity threshold was measured (Area %). The values represent the mean ± SE of four to five different fields from five to seven different animals: *P < 0.05 versus SAMR1; #P < 0.05 and ##P < 0.01 versus male; †P < 0.05 and ††P < 0.01 versus the trigone region (anova followed by Student's t-test).
