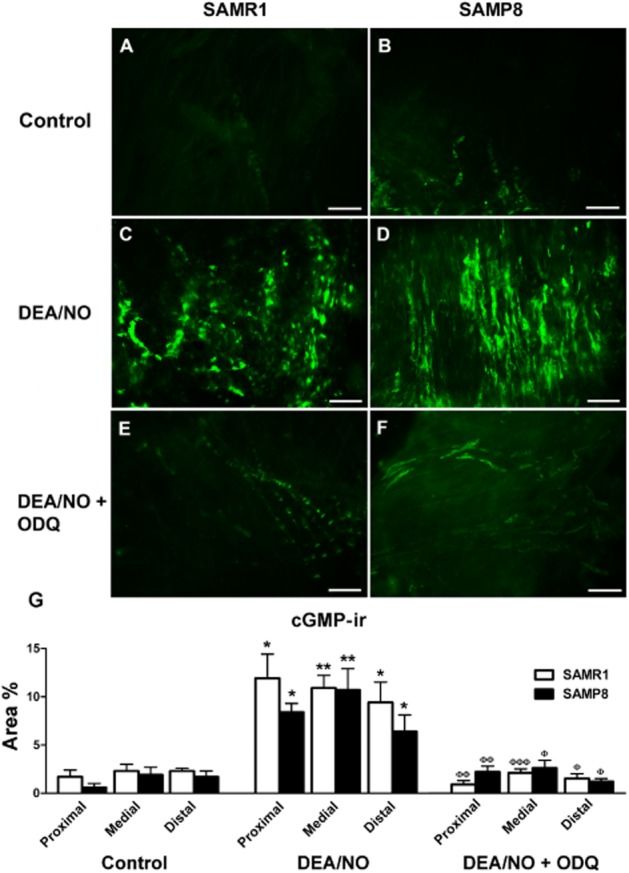
Figure 11.

cGMP-ir in SAMR1 and SAMP8 urethras. (A–F) Representative microphotographs showing cGMP-ir in the medial urethra of SAMR1 (A, C, E) and SAMP8 (B, D, F) mice in the presence of IBMX and zaprinast alone (1 and 0.1 mM, respectively, for 4 min; A, B, controls), as well as after the addition of DEA/NO (0.1 mM, 4 min)\ in the presence (E, F) or absence (C, D) of ODQ (0.1 mM). The experimental protocol used is described in Figure 10. Note the weak cGMP-ir in control conditions (A, B) compared with that induced by DEA/NO (C, D), and the dramatic reduction in cGMP-ir following exposure to ODQ (E, F). Scale bar = 50 μm. (G) Quantification of cGMP-ir in the SAMR1 and SAMP8 urethras. Measurements were taken independently in different regions of the urethral muscular layer (proximal, medial and distal). Hand-drawn fields of whole-mount preparations were selected and the relative area above the intensity threshold was measured (Area %). The values represent the mean ± SE of three to five different fields from four to five different animals: *P < 0.05 and **P < 0.01 versus controls; ΦP < 0.05, ΦΦP < 0.01 and ΦΦΦP < 0.001 versus preparations exposed to DEA/NO in the absence of ODQ (anova followed by Student's t-test).
