
Figure 6.
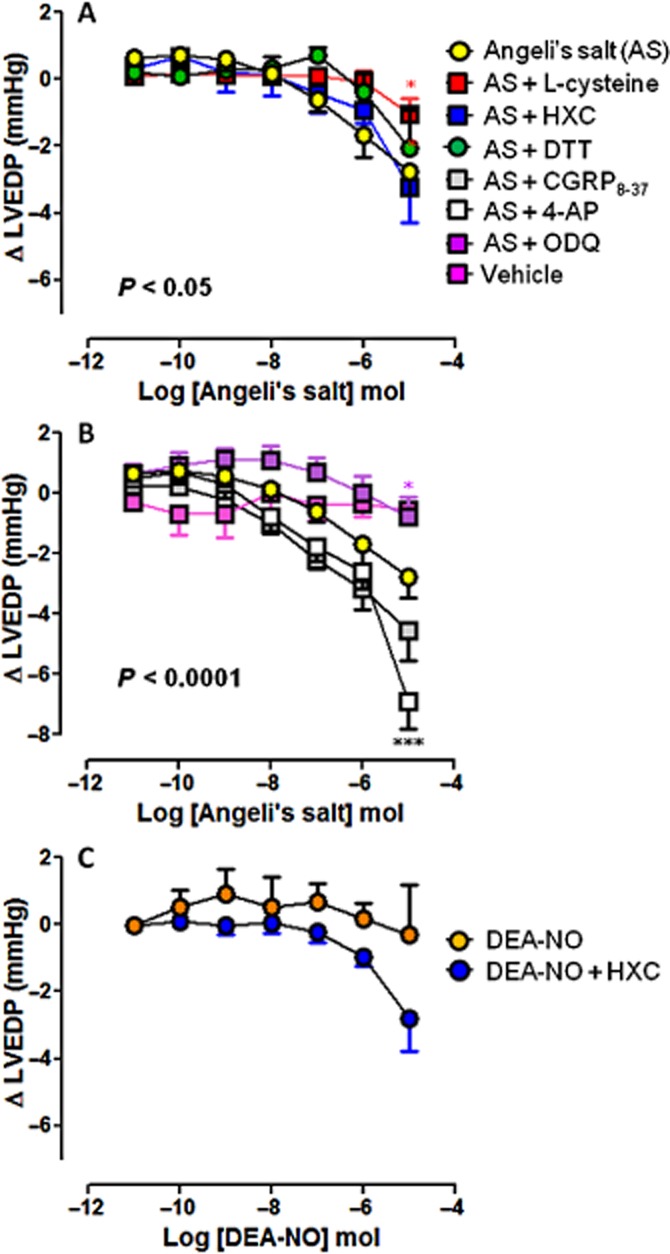
Dose–response curves to Angeli's salt (AS) (n = 8) on LVEDP in the absence and presence of (A) L-cysteine (n = 6), HXC (n = 5) or DTT (n = 5); and (B) ODQ (n = 6), CGRP8–37 (n = 5) and 4-AP (n = 5). Serial bolus doses of 10 mM NaOH vehicle are shown for comparison (n = 3). *P < 0.05, ***P < 0.001 versus AS on two-way anova with Bonferroni post hoc test for multiple comparisons. (C) The dose–response curves to DEA-NO (n = 5) on LVEDP in the absence and presence of HXC (100 μM, n = 5) are shown for comparison.