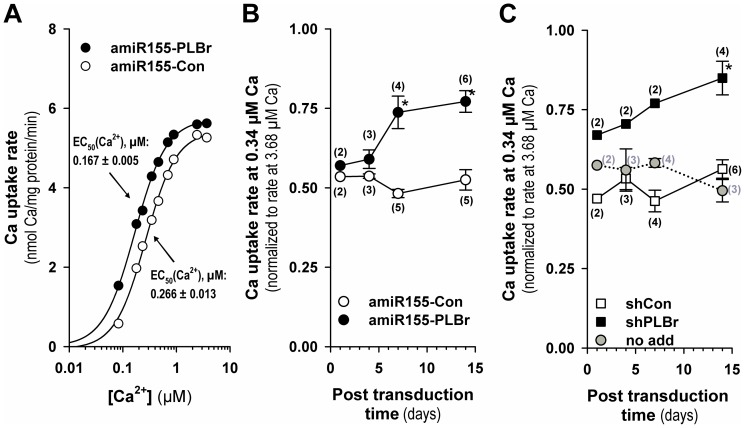
Figure 4. Sarcoplasmic reticular (SR) Ca2+ uptake activity in cardiomyocyte homogenates after amiR155-PLBr- and shPLBr-mediated PLB silencing.
(A) Ca2+ dependence of the cell homogenate oxalate-supported SR Ca2+ uptake rate at day 14 after transduction with either scAAV6-amiR155-PLBr (amiR155-PLBr) or scAAV6-amiR155-Con (amiR155-Con) vectors. Reticular Ca2+ transport was measured as oxalate-facilitated Ca2+ uptake. Rate values are means of two different transduction experiments with primary cultured CM (50x103 vg/c). Respective rate values were obtained by linear regression analysis of Ca2+ uptake data obtained 1, 2, and 3 min after initiation of the reaction. (B) SR Ca2+ uptake rates as a function of time after transduction with 25−50×103 vg/c of either scAAV6-amiR155-PLBr (amiR155-PLBr) or scAAV6-amiR155-Con (amiR155-Con) vectors. (C) SR Ca2+ uptake rates as a function of time after transduction with 25−50×103 vg/c of either scAAV6-shPLBr (shPLBr) or scAAV6-shCon (shCon). For B and C, cells were harvested at indicated time points post transduction and initial oxalate-facilitated Ca2+ uptake rates were determined at both submicromolar (0.34 μM) and saturating (3.68 μM) free Ca2+ concentrations. The shown relative rate values at submicromolar Ca2+ in B and C were obtained by normalization of the rate value at 0.34 μM Ca2+ to the respective maximum uptake rate values measured at a saturating Ca2+ concentration of 3.68 μM. Values in B and C are means ± SEM for 2 to 6 different cell experiments as indicated in parenthesis, *p<0.05 vs. respective control vector. The column labeled no add contains nontransduced cells.

