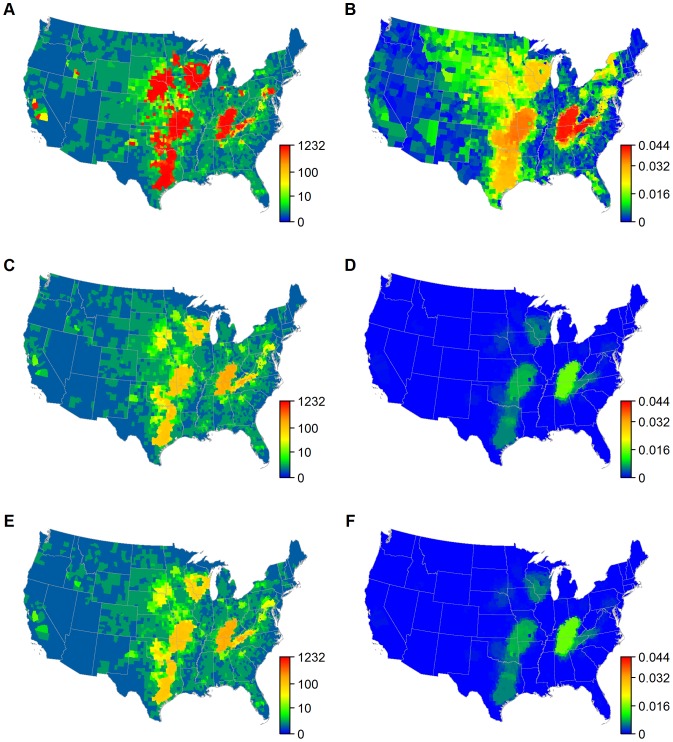
Figure 5. Epidemic extent and infection risk with unrestricted, county and, state movement bans.
Upper tail of the distribution (based on the 97.5th percentile of 100 simulations) for epidemic extent and infection risk when infections are introduced to each of the 3109 counties of the continental US. (A & B) assume standard movements while (C & D) assume a county-level movement ban and (E & F) assume a state-level movement ban. (A, C, & E) the epidemic extent (the number of counties infected) for an infection seeded in each county. (B, D, & F) the infection risk (the proportion of all simulated outbreaks that infect a county).

