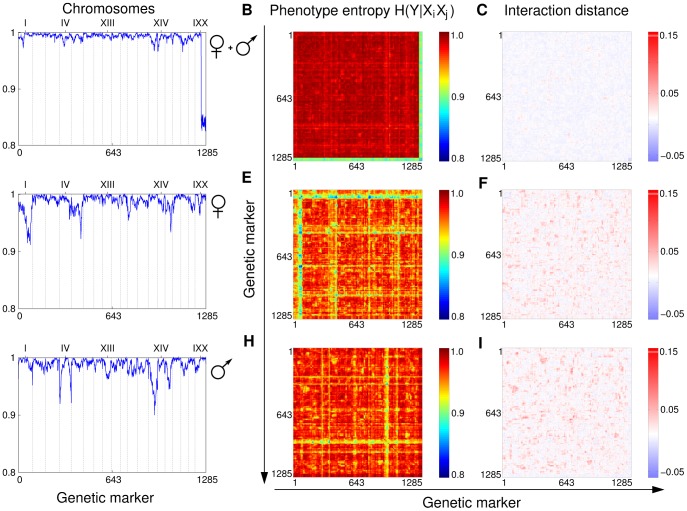
Figure 2. Genetic interactions in body weight phenotype of mouse.
The first row, panels (A–C), shows results of the genetic analysis of the body weight for the full cohort of 303 mice (no sex division). Panel (A) shows conditional entropy  , (B) shows
  and (C) shows the interaction distance. The strongest effect on the phenotype in this case comes from markers located on the Y chromosome present only in males. This is expected since the weight is strongly correlated with the sex. Rows (D–F) and (G–I) show data for female and male subpopulations respectively. A comparison of (D) and (G) reveals sex specific QTLs affecting the phenotype. Panels (B), (E) and (H) exhibit the characteristic stripe pattern, which masks the more subtle synthetic and modifying interactions. Finally, (C), (F) and (I) plot the ID scores for all pairs of markers. The red spots in panels (C, F, I) and blue/yellow spots in panels (B, E, H) point out potentially interesting pairs, which are a subject of further investigation.

