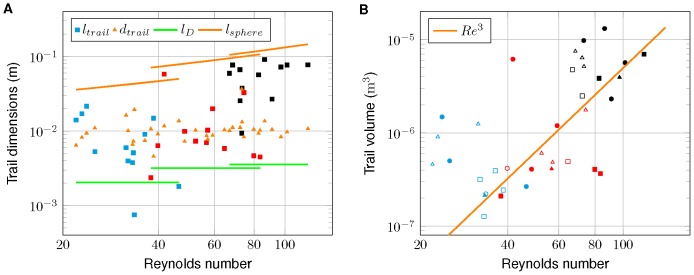
Figure 5. Observed trail dimensions vs. Reynolds number.
(A) Observed trail length (squares) and trail diameter (triangles) vs. Reynolds number. Distinct colors of square markers indicate different age groups (cyan-5 days, red-20 days, and black-35 days). Daphnia length (green lines) and the length of corresponding sphere wakes (Equation 4) are shown for mean Reynolds number of the three age groups. (B) Observed trail volume vs. Reynolds number. Symbol color indicates age group, filled markers represent wakes and open markers jets. Distinct swimming patterns are indicated by square (cruising), triangle (hopping and sinking), and circle (looping). The line represents a proportionality to the  .
.

