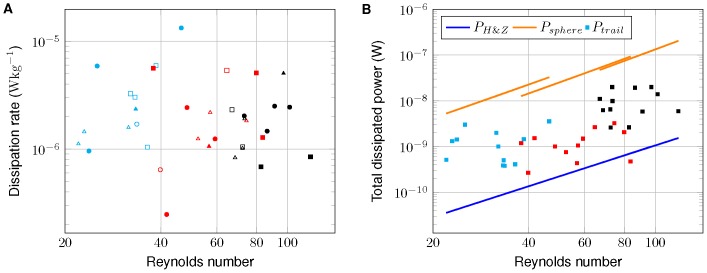
Figure 6. Trail-averaged viscous dissipation rates and total dissipated power within the trail vs. Reynolds number.
(A) Trail-averaged viscous dissipation rates (total dissipated power/trail volume) vs. Reynolds number. Distinct colors indicate age groups (cyan-5 days, red-20 days, and black-35 days), filled markers represent wakes and open markers jets. Different swimming patterns are indicated by square (cruising), triangle (hopping and sinking), and circle (looping). (B) Total dissipated power within the trail vs. Reynolds number. Colors indicate age groups. The blue line shows dissipated power estimated according to Huntley and Zhou [9] (Equation 3), and the orange line the modified approach for a sphere (Equation 4).

