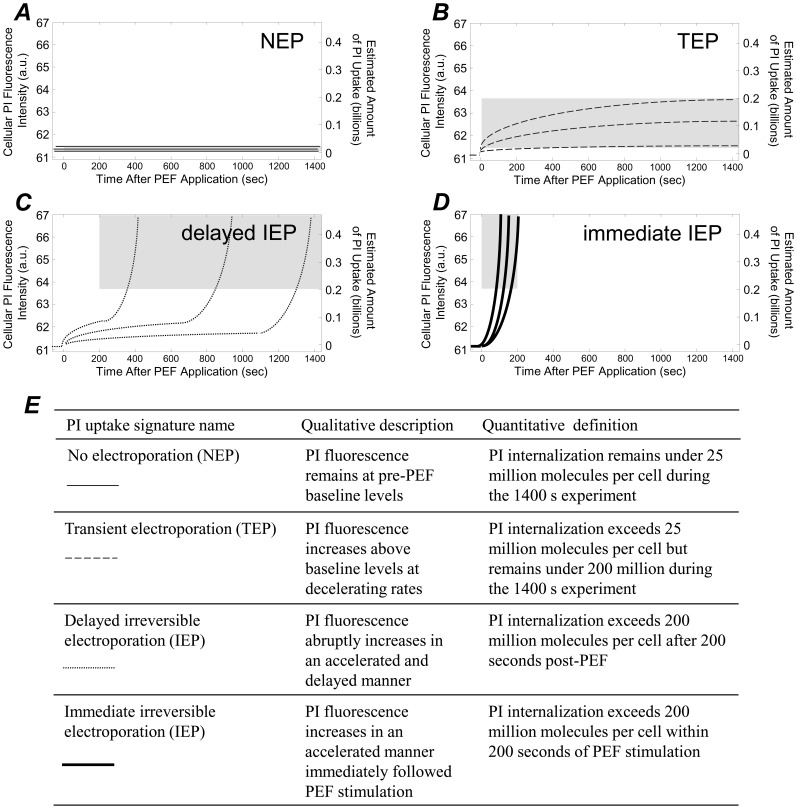
Figure 5. PI uptake versus time signatures from every experiment from each cell fell into one of four categories, as defined here.
A: The NEP signature is assigned to cells that remain at baseline PI fluorescence levels of <25 million molecules per cell during the 1400 second experimental time course. B: The TEP signature is assigned to cells that internalize between 25 and 200 million PI molecules per cell during the 1400 second time course. C: The delayed IEP signature is assigned when cells internalize more than 200 million PI molecules per cell between 200 and 1400 seconds after PEF stimulation. D: The immediate IEP signature is assigned when cells internalize more than 200 million PI molecules within the first 200 seconds after PEF exposure. E: A table summarizing the names, qualities, and quantitative definitions of each signature. In A–D, grey regions on plots are provided to indicate the widows defining the uptake signature in terms of PI uptake amount and timeframes.

