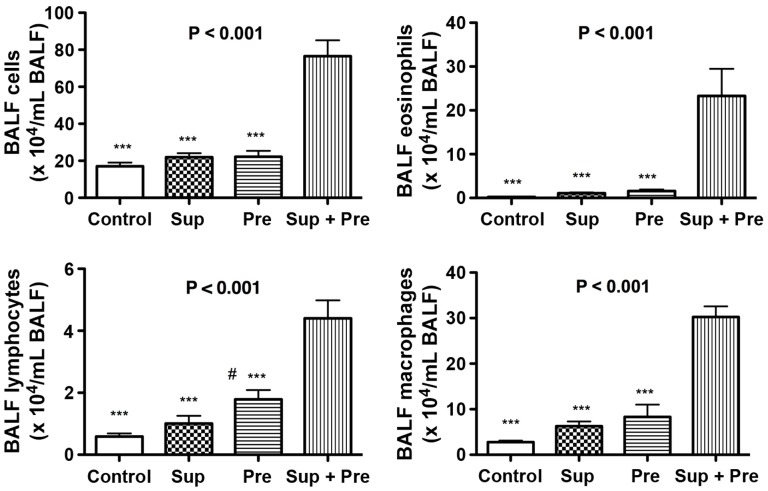
Figure 2. BALF cell numbers of total cell fraction, eosinophils, lymphocytes and macrophages.
The counts of these cells in the BALF are expressed as mean ± SEM of 4–8 animals (n = 8, 6, 4 and 4 for Control, Sup, Pre and Sup+Pre groups, respectively). P for ANOVA is expressed in the upper portion of each figure. Tukey’s multiple-comparison test results are shown in the mouse groups of control, Sup and Pre compared with the mouse group of Sup plus Pre as ***P<0.001 and the Pre group compared with the control as # P<0.05.

