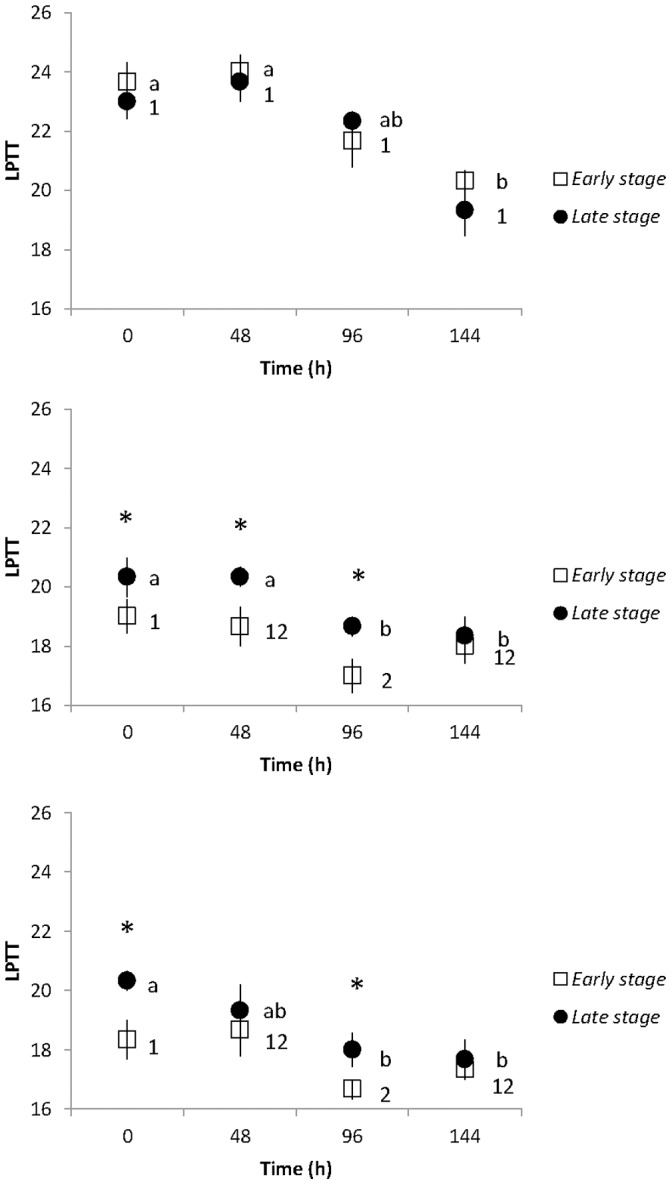
Figure 3. The lipid phase transition temperature (LPTT) of early and late stages oocytes of Juncea fragilis (a), J. juncea (b), and Ellisella robusta.

Error bars indicate standard error of the means. Astrices represent significant difference between early and late stage at the same chilling time period (p<0.05).
