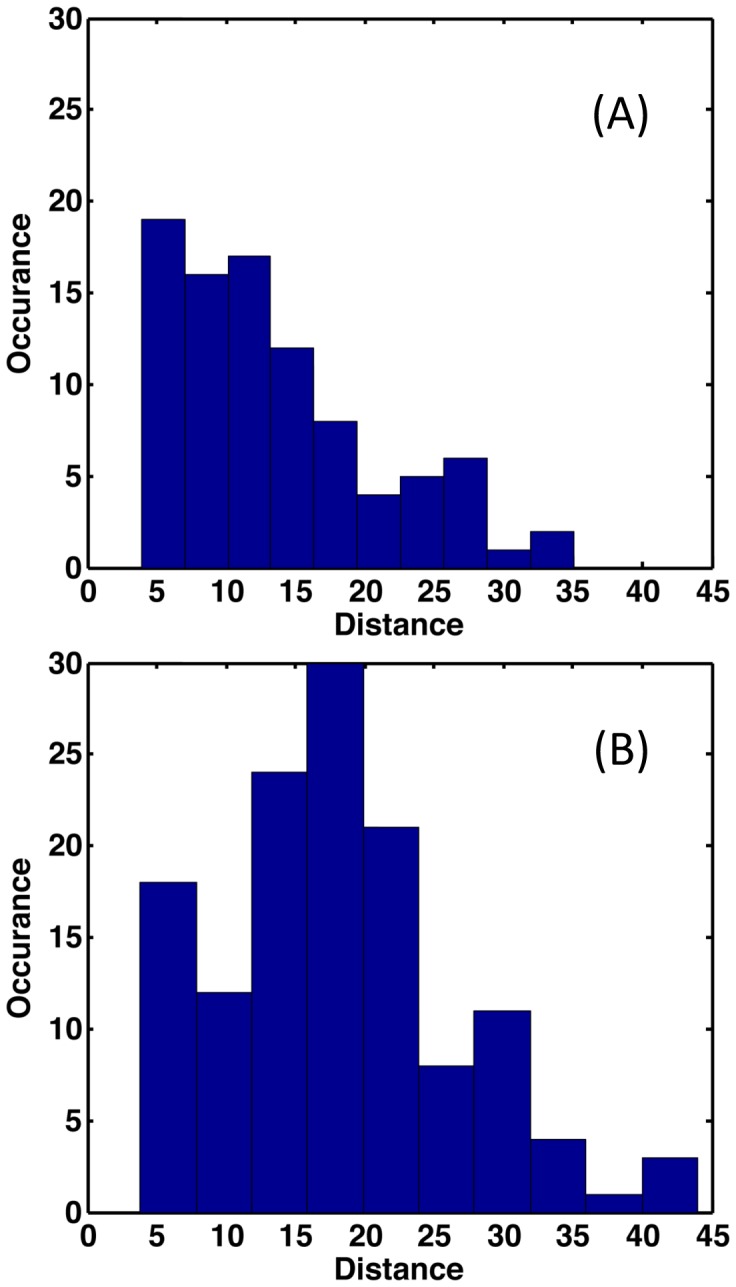
Figure 6. Statistically significant changes in rigidity (p<0.01) are tabulated based on the distance between them and the closest constituent mutation.

Note that the average distance in the increased rigidity response (A) is significantly less than increased flexibility (B), 13.6 Å vs. 17.9 Å, respectively.
