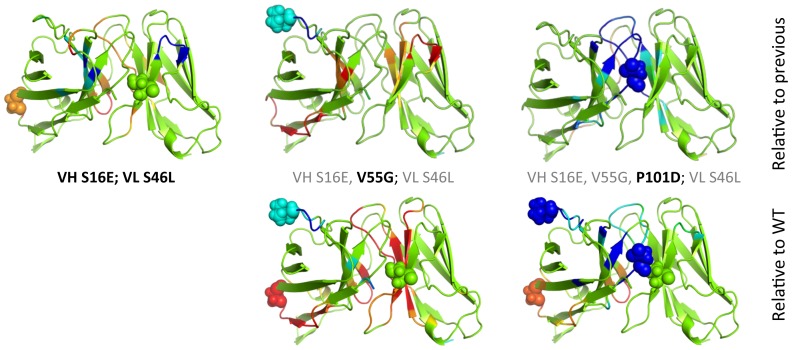
Figure 9. Using the same coloring scheme as Figure 5, rigidity/flexibility changes that occur as additional mutations are added are described.
The top row compares, from left to right, the double mutant to the wild type, the triple mutant to the double, and the quadruple to the double, which corresponds to the fewest number of per residue changes. The bottom row re-plots the corresponding structures from Figure 5 , which are relative to wild type, so the per residue effects can be compared to the global changes.

