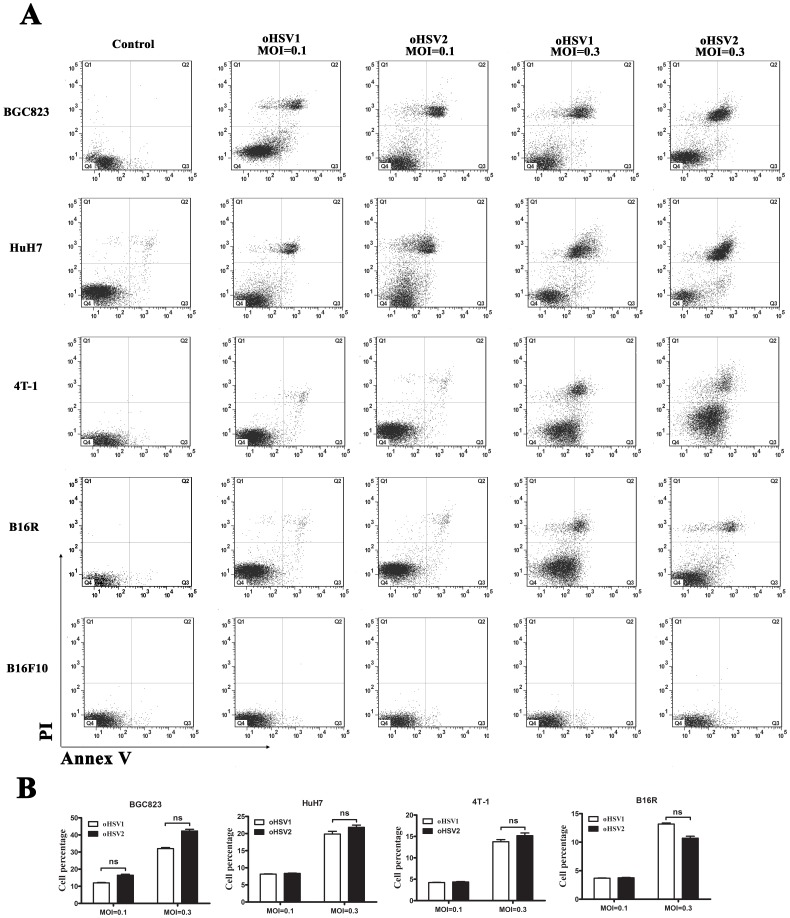
Figure 4. In vitro comparison of oHSV2 with oHSV1.
Both oHSV1 and oHSV2 induces necrosis in cancer cells. A) Flow cytometry analysis of cancer cell lines after oHSV2 or oHSV1 infection at the indicated MOIs for 24 h. B) The necrosis rates of the cancer cell lines were measured after oHSV2 or oHSV1 infection. Each value represents the mean ± SED of three independent samples. ns, no significant differences.

