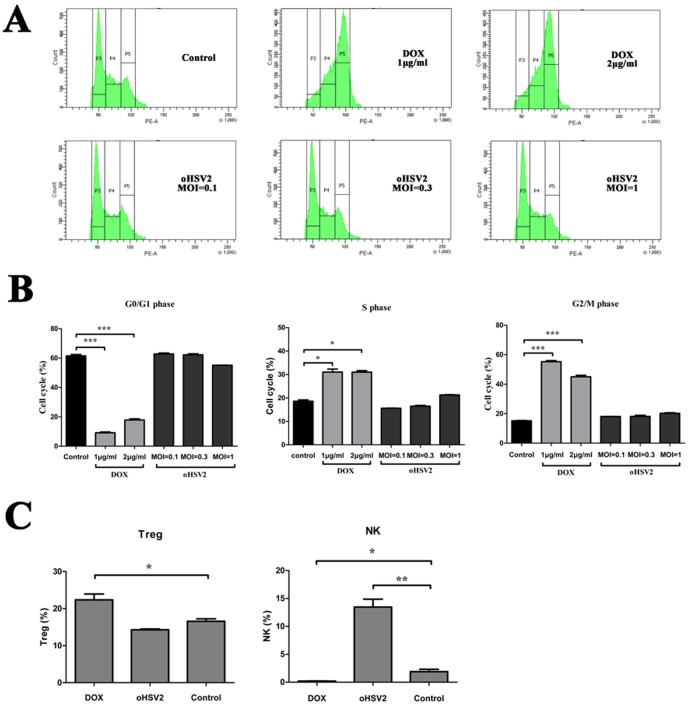
Figure 5. The oncolytic effect of oHSV2 on 4T1 tumor cells is independent of the cell cycle, but oHSV2 increases the NK ratio in vivo.
A) An cell cycle assay as described in the Methods section. Representative images of flow cytometry from the different groups are depicted. B) 4T1 cells were treated with oHSV2 or different doses of DOX for 24h. Cell cycle specificity analysis was performed using flow cytometry. C) The percentage of NK and Treg cells after oHSV2 or DOX treatment was assayed. Statistical analysis was performed using an unpaired Student’s t test: *, p<0.05; **, p<0.01; and ***, p<0.001.

