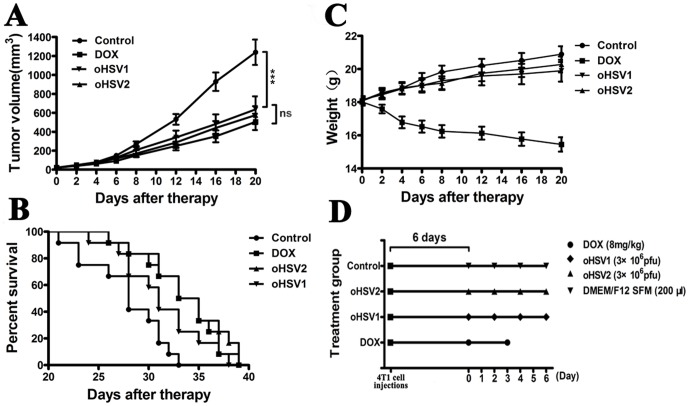
Figure 6. Anticancer effect of DOX, oHSV1 and oHSV2 in 4T1 breast tumors.
The mice bearing 4T1 tumors were treated with DOX, oHSV1 or oHSV2 as described in the Materials and Methods section. A) The tumor volume was measured every 4 days following treatments. The data are presented as the mean ± SEM (n = 12), p<0.001. B) The median survival times for the 3 groups are illustrated in Kaplan–Meier survival curves (n = 12). Median survival: Control, 28 days; DOX, 34 days, p = 0.0034; oHSV2, 34 days, p = 0.0009; and oHSV1, 31 days, p = 0.0043. C) The weight of the mice was measured every 4 days following treatments. The data are presented as the mean ± SEM (n = 12). ***, p<0.001 and ns, no significant differences. D) Schematic of the experimental design. Each spot represents one treatment.

