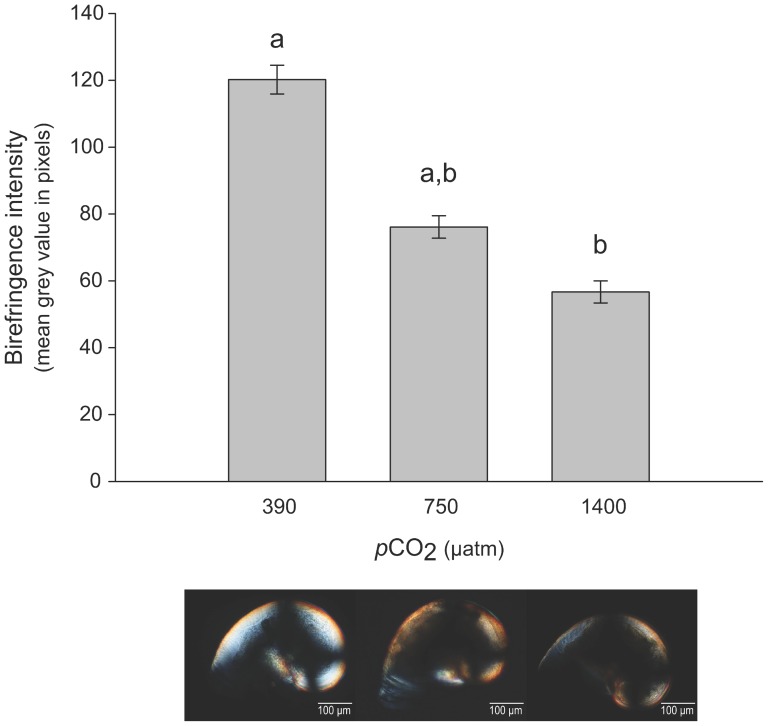
Figure 6. Birefringence intensity.
Mean gray value (in pixel) of the shells under polarized light in the different pCO2 treatments (± SE). Bars with different letters are significantly different (Dunn post-hoc test, p<0.05,), n = 5 to 8 larvae per condition. Pictures taken under polarized light (below the graph) show birefringent patterns in the different pCO2 treatments.

