
Figure 3. Responses of the giant panda sweet taste receptor T1R2+T1R3 to sugars and artificial sweeteners.
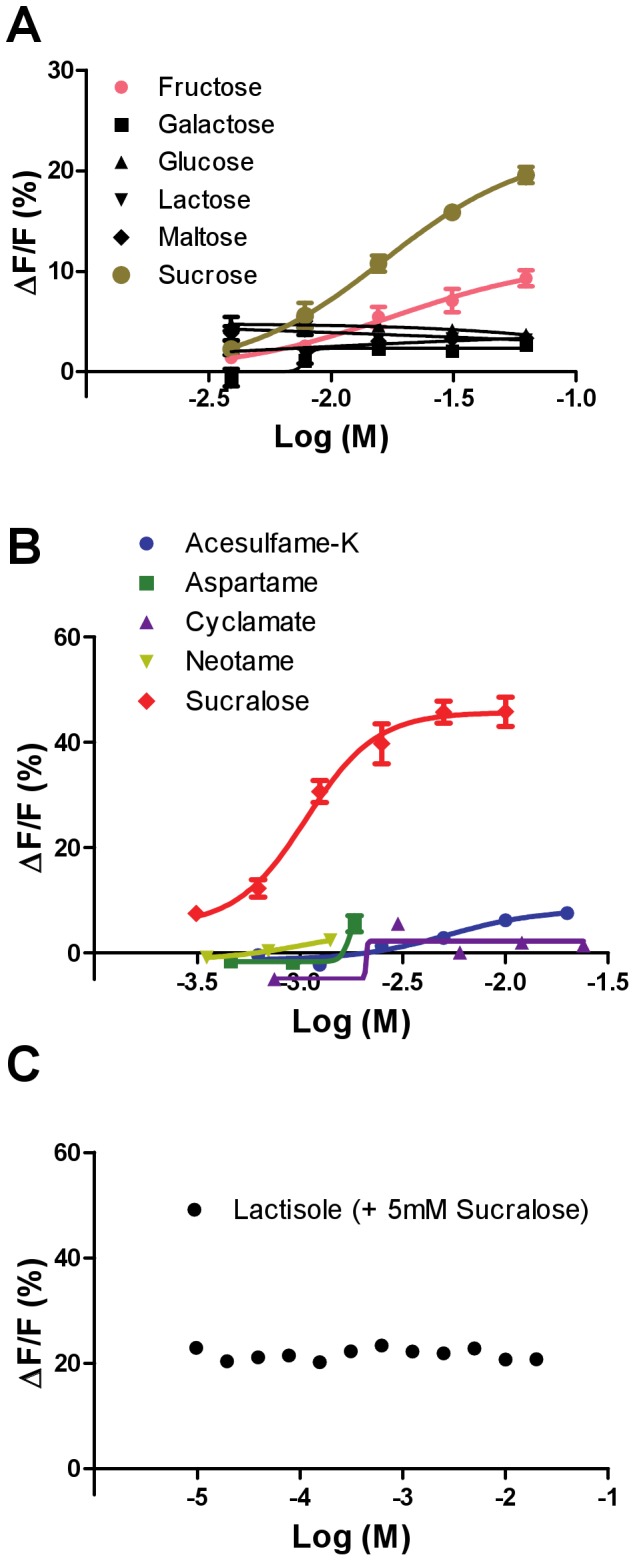
T1R2+T1R3 was stably expressed in HEK293 cells along with Gα16-gust44. The receptor-expressing cells were then assayed by calcium mobilization for their dose-dependent responses to sugars (A), artificial sweeteners (B), and the sweet inhibitor lactisole (C). Data are expressed as percent change in fluorescence (ΔF = peak fluorescence – baseline fluorescence) from baseline fluorescence (F). The values represent the mean ± SEM of ΔF/F for five or six independent responses.