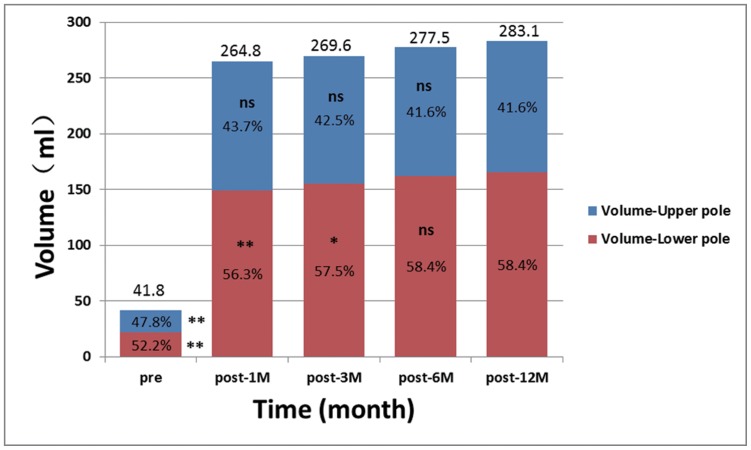
Figure 7. Breast volume and volumetric distribution.
A horizontal plane (XZ plane) was placed through nipple level to divide the breast into upper and lower poles. The volumes of each pole and the volumetric distribution were calculated at each time point in percentage. The volumetric percentages of lower pole increased over time while the opposite for the upper pole. The percentage of upper and lower pole at each time point was compared with post-12M. ** is p<0.01, * is p<0.05, ns is no significant difference. Post-6M vs. post-12M of lower pole breast volume: p>0.05. Post-1M vs. post-12M of upper pole breast volume: p>0.05.

