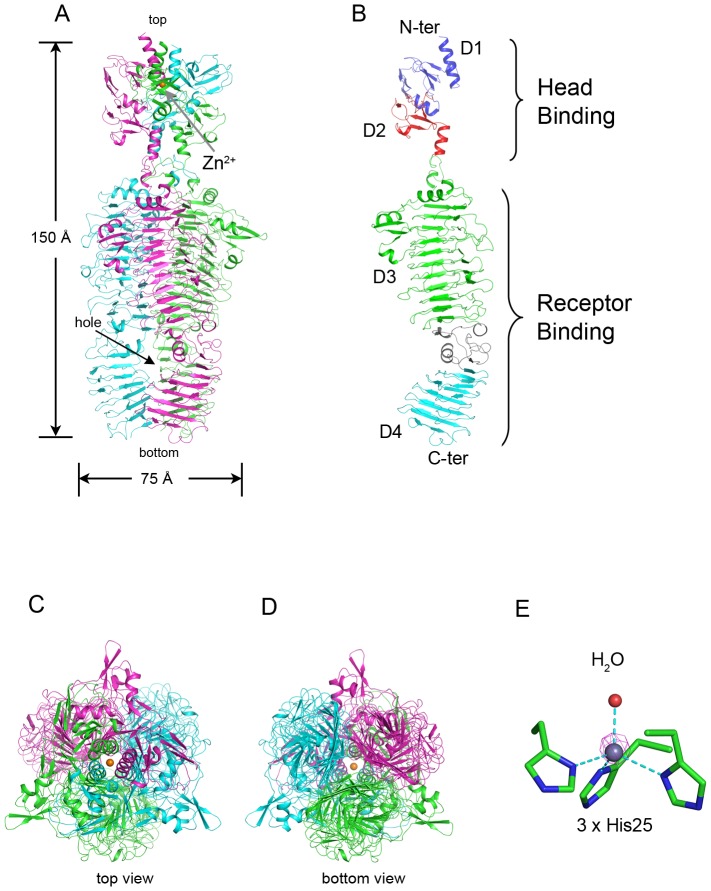
Figure 2. Structure of TSP1 from bacteriophage CBA120.
(A) “Side view” of the homotrimer. The three monomers are colored in green, cyan, and magenta. The Zn2+ is shown as an orange sphere and indicated by an arrow. The “hole” in the catalytic domain is indicated. (B) The structure of TSP1 monomer. The N-terminal head binding domain and a C-terminal receptor-binding domain are further divided into four subdomains, D1, D2, D3, and D4 colored in blue, red, green, and cyan, respectively. The D3-D4 intervening region that bends the β-helical axis is colored in grey. (C) and (D) “Top view” (down from the N-terminus) and “bottom view” (down from the C-terminus), respectively. (E) Anomalous difference map calculated with diffraction data collected at the zinc absorption edge peak (1.28283 Å). The calculated phases included only the protein atoms. The Zn2+ coordinates His25 of each subunit and a water molecule. The anomalous difference map (magenta cage) is contoured at 15σ.

