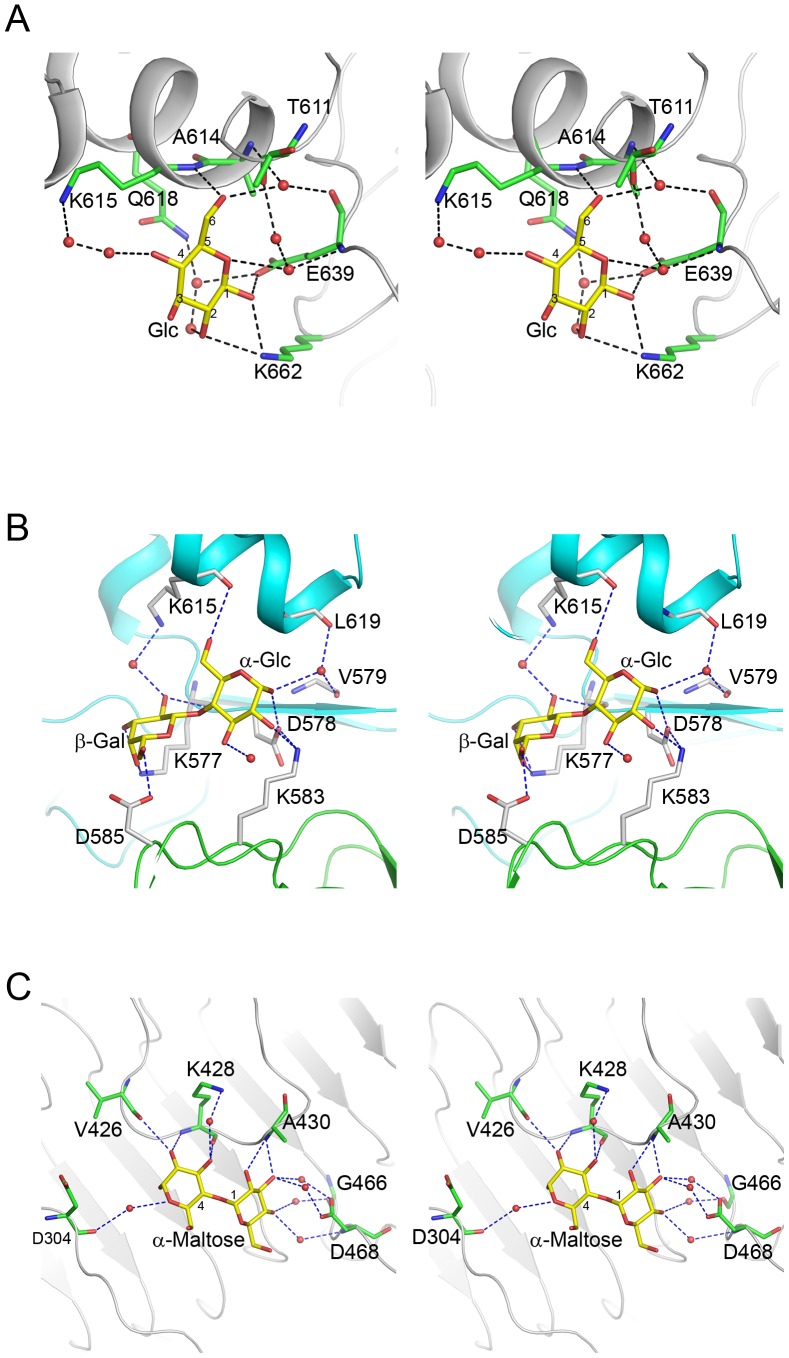
Figure 6. Stereoscopic representation of the environment of sugars bound to TSP1.
Ligands and interacting protein residues are shown as stick models and water molecules as spheres. The atom color scheme is as follows: Nitrogen – blue, oxygen – red, ligand carbon – yellow, protein carbon – green. Hydrogen bonds are shown as dashed lines. (A) Glucose. (B) Lactose. (C) Maltose. The cartoon models are colored gray in (A) and (C). The cartoon models of two TSP1 molecules that contribute to the lactose binding are colored green and cyan in (B).

