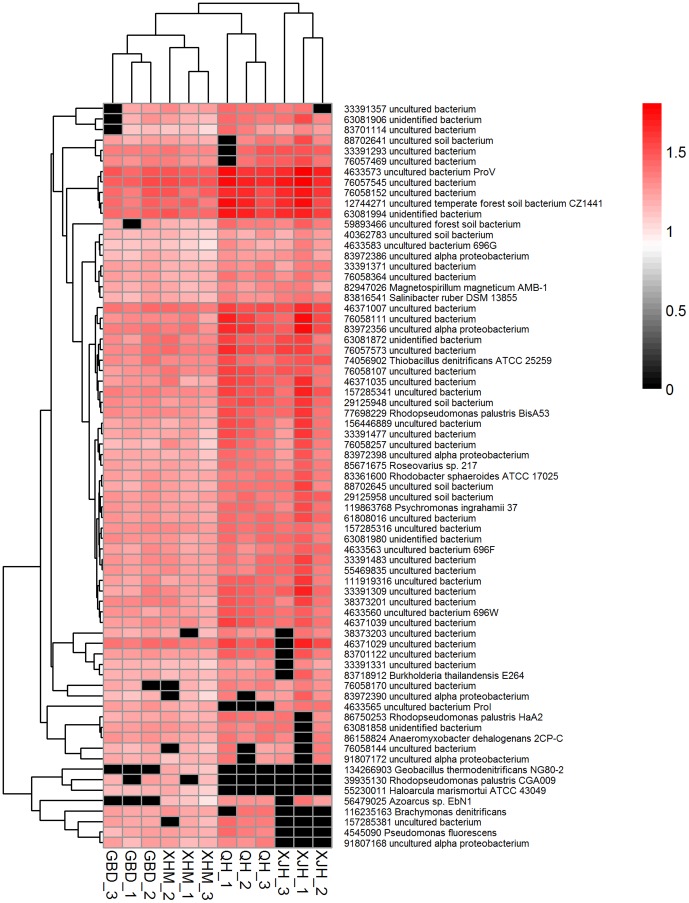
Figure 4. The hierarchical cluster analysis of nosZ genes encoding nitrous oxide reductases.
The protein id number and its derived organism for each gene are indicated. The color intensity of each panel shows the normalized signal intensity of individual genes, referring to color key at the top right.

