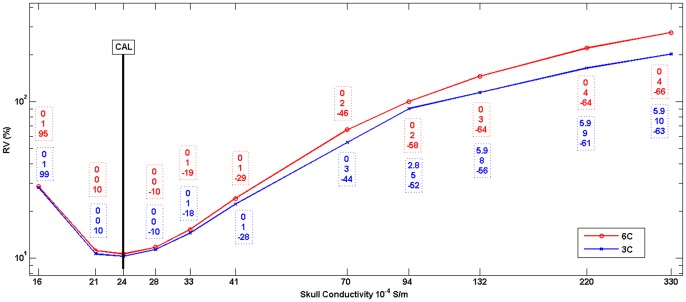
Figure 3. Skull conductivity calibration graph.
RV (in %) obtained from Algorithm 2 in step 2.d. for different skull conductivity parameters for 6C (red) and 3C (blue) head models. The differences to the calibrated head models 6C_Cal and 3C_Cal (indicated by the black bar, see also Table 1) in source reconstruction are indicated by boxes with dashed frames: Difference in source location x (top row, in mm), orientation o2 (middle row, in degree) and strength m2 (bottom row, in %).

