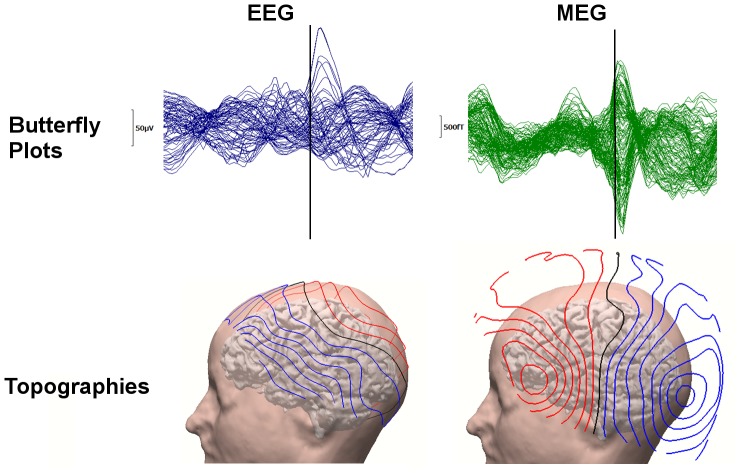
Figure 4. The waveform and topography of an example epileptic spike.
FT9 spike: 71 channel EEG (left column) and 129 channel MEG (right column) butterfly plots (upper row, time-point −13 ms marked with a black line) and corresponding topographies from left view at time-point −13 ms plotted on individual brain and skin (bottom row).

