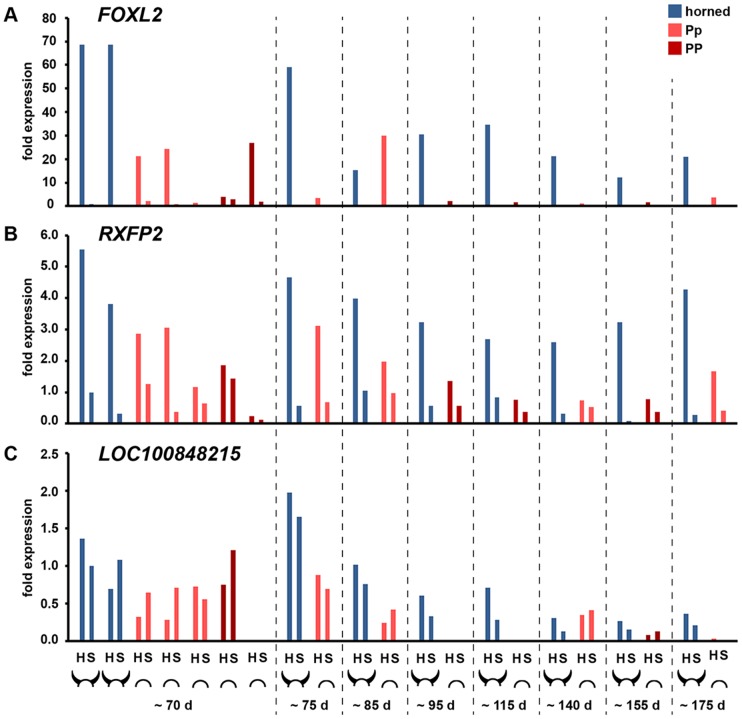
Figure 3. Gene expression study based on RT-PCR.
Relative expression of FOXL2 (A), RXFP2 (B), and LOC100848215 (C) transcripts in fetal skin and horn bud biopsies of different developmental stages and different polled genotypes. Different fetal stages are divides in eight groups of estimated age (d). Wildtype fetuses are marked with the shape of a horned cow head, fetuses carrying the polled mutation are marked with the shape of a polled cow head, whereas each icon designates one fetus. For each individual a biopsy of the horn bud area (H) and a biopsy of the frontal skin (S) were studied. Expression levels in wildtype fetuses are shown in blue, those of heterozygous Pp polled fetuses in orange and those of homozygous PP polled fetuses in dark red. Expression levels are normalized to the average of three control genes and shown as relative expression in relation to the frontal skin sample of the youngest horned fetus.

